Most Shopify funnel audits start with checkout abandonment, then spend weeks trying to reduce it. That’s understandable, because cart and checkout losses are visible, familiar, and easy to report. But treating checkout as the default culprit often sends teams toward the wrong fix while product and category pages lose the larger audience upstream.
Conversion funnel analysis is useful because it replaces one flattering or alarming store-wide number with a sequence of measurable decisions. You can define each transition, compare performance by segment, estimate the revenue attached to each leak, and test one change without sacrificing margin or brand perception for a temporary lift.
Why Your Checkout Is Not Always the Leak
Checkout abandonment deserves attention, but it is often the wrong starting point. Baymard’s research places the global average cart abandonment rate at 70.22%, based on 50 studies, and reports that the rate has stayed close to 70.19% for 14 years (Baymard cart abandonment research summary). That makes checkout a necessary area to investigate, not an automatic explanation for weak revenue.
The larger leak often appears earlier. A store can lose 60% to 80% of qualified traffic before a shopper adds anything to the cart, as illustrated by the stage benchmarks below. Category pages may fail to narrow the choice, while product pages leave questions about fit, delivery, proof, or value unanswered. Checkout work then reaches only the shoppers who survived those decisions.
Operator’s rule: Optimize the leak that can recover the most profitable demand, not the leak that is easiest to see.
The 2026 benchmark set shows why stage-level analysis changes the diagnosis. It reports 43% of homepage visitors reaching category pages, 38% of category-page visitors reaching product pages, and 12.4% of product-page visitors adding to cart (2026 ecommerce conversion benchmarks). It also reports 51% of cart users initiating checkout, 63% of checkout initiators entering payment, and 74% of payment entrants completing the order. These transitions expose where intent weakens. A single purchase rate cannot show that sequence.
The audit starts before the cart
A store-wide conversion rate blends products, devices, channels, customer types, and funnel stages. Strong returning-customer performance can hide a broken mobile product template. Healthy organic search can conceal an expensive paid-social audience. Aggregate performance makes both problems look smaller than they are.
Start the audit with five operating questions:
- Define the funnel: Use four to six clear stages, each tied to an event your systems can capture reliably.
- Measure transitions: Calculate the share moving from one stage to the next, rather than relying only on the final purchase rate.
- Segment the leak: Compare device, channel, geography, and customer type before selecting a remedy.
- Estimate potential gain: Rank opportunities by recoverable orders, revenue, and margin, not by visual appeal.
- Test one intervention: Give each priority leak a specific hypothesis and one primary success metric.
This approach treats CRO as an operating system for commercial decisions. A faster checkout can help shoppers already committed to buying, but it will not repair weak merchandising, unclear product value, or an offer that gives shoppers no reason to decide now.
Defining the Stages of a Shopify Conversion Funnel
A useful Shopify funnel is short enough to debug and detailed enough to locate friction. A practical model runs from landing entry to product view, add to cart, checkout start, purchase, and repeat purchase. Collection view or cart view can be added when the store needs to isolate merchandising or cart-specific behavior, but every extra stage should answer a real business question.
Modern funnel analysis calculates each stage as the share of users who progress from an earlier event to a later one. The standard formula is (number of users in the later stage ÷ number of users in the earlier stage) × 100 (2026 funnel benchmark methodology). This definition keeps teams from comparing incompatible rates, such as purchases divided by sessions in one report and purchases divided by checkout starts in another.
Build events that survive app changes
Shopify Analytics, GA4, checkout systems, email platforms, and ad pixels may use different names for similar actions. Your internal model needs stable business definitions, even if the implementation changes when you add an upsell app, subscription flow, or new theme.
| Funnel Stage | Triggering Event | Key Parameters |
|---|---|---|
| Landing entry | Session begins on a storefront page | Landing URL, source, medium, campaign, device |
| Product view | Product detail page loads | Product ID, collection, price, inventory status |
| Add to cart | Variant is added to cart | Product ID, variant ID, quantity, cart value |
| Checkout start | Checkout is created or initiated | Cart value, item count, customer status, discount |
| Purchase | Order is completed | Order ID, revenue, AOV, product mix, discount |
| Repeat purchase | Existing customer places another order | Customer ID, days since prior order, product category |
Use event names that describe the action, not the tool. “Product viewed” is more durable than a theme-specific label such as “PDP widget loaded.” Store the parameters required to diagnose a transition, especially product, device, source, customer type, and offer exposure.
A concise model also makes customer journey mapping easier to maintain across teams. Shopify merchants who want a broader perspective on planning can review this funnel advice for creators, then adapt the same principle to commerce events rather than content steps. Keep the customer journey map aligned with the events that determine revenue, as outlined in this guide to customer journey mapping.
Choose one counting method per question
A purchase funnel can be user-based, session-based, or order-based. None is universally correct. Session-based analysis helps diagnose storefront friction, while customer-based analysis is more useful for retention and repeat purchase. Write the counting rule into the dashboard description so a later analyst doesn’t mistake a change in methodology for a performance shift.
Multi-session paths need care. A shopper may discover a product on mobile, return through email, and complete checkout on desktop. If the store measures only one session, it can misclassify the journey and overstate abandonment. Set a reasonable conversion window, preserve campaign parameters, and make Shopify order data the final validation point for completed purchases.
Stage-by-Stage KPIs and What Healthy Looks Like
A checkout audit can look productive while revenue leak sits on the product or category page. Report movement between stages, then inspect the earliest transition producing a meaningful loss. Track session-to-product-view, product-view-to-cart, cart-to-checkout, checkout-to-purchase, and repeat-purchase rates. Add time between stages when shoppers commonly return before buying.
One 2026 benchmark reports an average global ecommerce conversion rate of roughly 2.5% to 3%, while another practical guide places overall purchase conversion around 2% to 3% (ecommerce funnel benchmark guidance). Use those ranges for orientation, not as a pass-fail standard. A furniture store may see a 1% to 2% add-to-cart rate for a high-AOV considered purchase, while a $20 accessory may reach 10% to 15%. Do not judge both against the same 8% to 10% expectation.
Read each transition as a diagnosis
| Stage Transition | KPI | Healthy Range |
|---|---|---|
| Session to product view | Product-view rate | About 45% to 50% in a representative ecommerce funnel |
| Product view to add to cart | Add-to-cart rate | About 8% to 10% |
| Add to cart to checkout | Checkout initiation rate | About 30% to 35% |
| Checkout to purchase | Checkout completion rate | About 45% to 50% |
| Full funnel to purchase | Overall conversion rate | About 2.5% to 3.2% globally |
These representative ranges come from 2026 ecommerce funnel benchmarks by stage and device. Treat them as directional. Product category, traffic quality, merchandising, shipping terms, and customer intent can shift every stage.
A low session-to-product-view rate points to landing-page relevance, navigation, page speed, or traffic quality. A weak product-view-to-cart rate usually warrants a product-page audit. Check offer clarity, variant selection, reviews, delivery information, and perceived value before changing checkout. Cart-to-checkout weakness can indicate surprise costs, confusing cart architecture, or an offer that fails to create enough urgency for the next step.
Don’t let the average choose the project
A 2026 benchmark across 2,800 Shopify stores reports a median 4.6% of visits adding to cart but only 1.4% converting to purchase (Shopify funnel statistics for 2026). That gap shows how intent can disappear after the cart. It does not prove checkout is the right project. If product pages create too few qualified carts, improving payment completion will have limited revenue impact.
Use step conversion to diagnose one transition. Use a weighted drop-off score to compare the whole funnel, giving more weight to stages with larger audiences, stronger intent, or higher contribution margin. Choose the loss that is recoverable, credible, and large enough to justify a test, rather than automatically selecting the lowest rate.
Segmenting the Funnel by Device Channel and Customer
Aggregate funnel performance is an average of unlike experiences. Break every transition by device, acquisition channel, and customer type before you decide that a page or offer is broken.
Device segmentation should begin with mobile, desktop, and tablet. Channel cuts should include paid social, organic search, email, SMS, direct, and affiliate where the store has enough volume to make comparisons meaningful. Customer cuts can separate new and returning shoppers, logged-in and guest users, B2C and wholesale traffic, and customers exposed to a promotion from those who weren’t.
A 2026 benchmark summary reports roughly 80% mobile abandonment versus about 66% desktop abandonment (mobile and desktop cart abandonment benchmarks). That difference doesn’t tell you which element is failing, but it does justify a mobile-first checkout and cart investigation. Look for small-screen problems such as hidden delivery terms, difficult variant controls, sticky elements covering the purchase button, or payment options that don’t appear clearly.
Build a measurement governance layer
Shopify Analytics is often the strongest source for orders, revenue, discounts, and customer records. GA4 is useful for acquisition paths, landing behavior, and event exploration. Session replay can reveal hesitation, rage clicks, dead ends, and mobile layout failures. Ad platforms are useful for campaign optimization, but their attribution windows can make reported conversions look different from Shopify orders.
Before launching a test, assign one primary source of truth for each core metric. Shopify should generally own completed order and revenue reconciliation, while GA4 can own the agreed storefront event model if the team has validated its implementation. Use other systems for directional validation, not as competing final authorities.
Document the rules:
- Event definitions: Specify exactly what counts as product view, add to cart, checkout start, and purchase.
- Attribution windows: Record the window used by each ad or campaign report.
- UTM standards: Keep source, medium, campaign, and content values consistent.
- Identity handling: Decide how guest, logged-in, and cross-device activity is joined.
- Reconciliation checks: Compare event totals with Shopify orders before trusting a trend.
The same discipline used to analyze customer groups applies to funnel work. A practical explanation of cohort analysis for ecommerce teams can help separate new-customer acquisition from repeat behavior, but the definitions still need to match the store’s reporting governance.
Turning Funnel Data Into Revenue Impact
Percentages help teams locate friction. Revenue math helps them decide what deserves engineering, design, merchandising, or promotional attention.
A simple model is sessions × stage conversion × AOV = stage output. For a full funnel, multiply the relevant transition rates in sequence, then compare the resulting orders and revenue with a realistic target. The point isn’t to predict perfectly. It’s to make assumptions visible and compare opportunities using the same financial language.
Suppose a store’s add-to-cart rate is 1.5% and a proposed change could lift it by half a point. That early improvement affects every downstream shopper who enters the cart. A 5% checkout-completion improvement may be valuable, but it applies only to the smaller group that already reached checkout. Which opportunity wins depends on sessions, downstream rates, AOV, contribution margin, and whether the change cannibalizes other orders.
Build a leakage table
Use Shopify Analytics for sessions and funnel events, then validate AOV from an orders export. Keep current and target assumptions separate from observed results. The example below intentionally uses placeholders because a useful revenue forecast must come from your store’s own data.
| Stage Transition | Current Rate | Target Rate | Incremental Monthly Orders | Incremental Monthly Revenue |
|---|---|---|---|---|
| Session to product view | Enter store rate | Defensible target | Calculated from sessions | Orders × store AOV |
| Product view to add to cart | Store baseline | Test target | Calculated from product views | Orders × store AOV |
| Add to cart to checkout | Store baseline | Test target | Calculated from carts | Orders × store AOV |
| Checkout to purchase | Store baseline | Test target | Calculated from checkouts | Orders × store AOV |
This table forces the team to answer practical questions. How many sessions are eligible? Does the target reflect a measured opportunity or wishful thinking? Are the added orders full-price, discounted, or generated by a promotion with a different margin profile?
Revenue is not the same as profit
A blanket discount can lift a stage while lowering contribution margin. A redesigned product page can improve conversion while shifting demand toward a lower-margin SKU. An email reminder can recover an order that would have returned organically, creating an apparent win without equivalent incremental revenue.
Account for cannibalization, assisted conversions, repeat purchase behavior, discount cost, and inventory constraints. A 2026 benchmark also reports a typical cart abandonment rate near 76%, reinforcing how much apparent opportunity sits in incomplete journeys (2026 conversion rate benchmark data). That opportunity still needs qualification. Prioritize the intervention that recovers profitable demand, not the one that produces the most attractive percentage in a presentation.
Prioritizing Leaks and Running One Good Experiment
When every team member has a favorite page to redesign, use a shared scoring model. Rate each potential leak from 1 to 5 on revenue impact, confidence in the diagnosis, and cost of change. To make higher scores consistently better, rate a low-cost change with a high score, then add the three values.
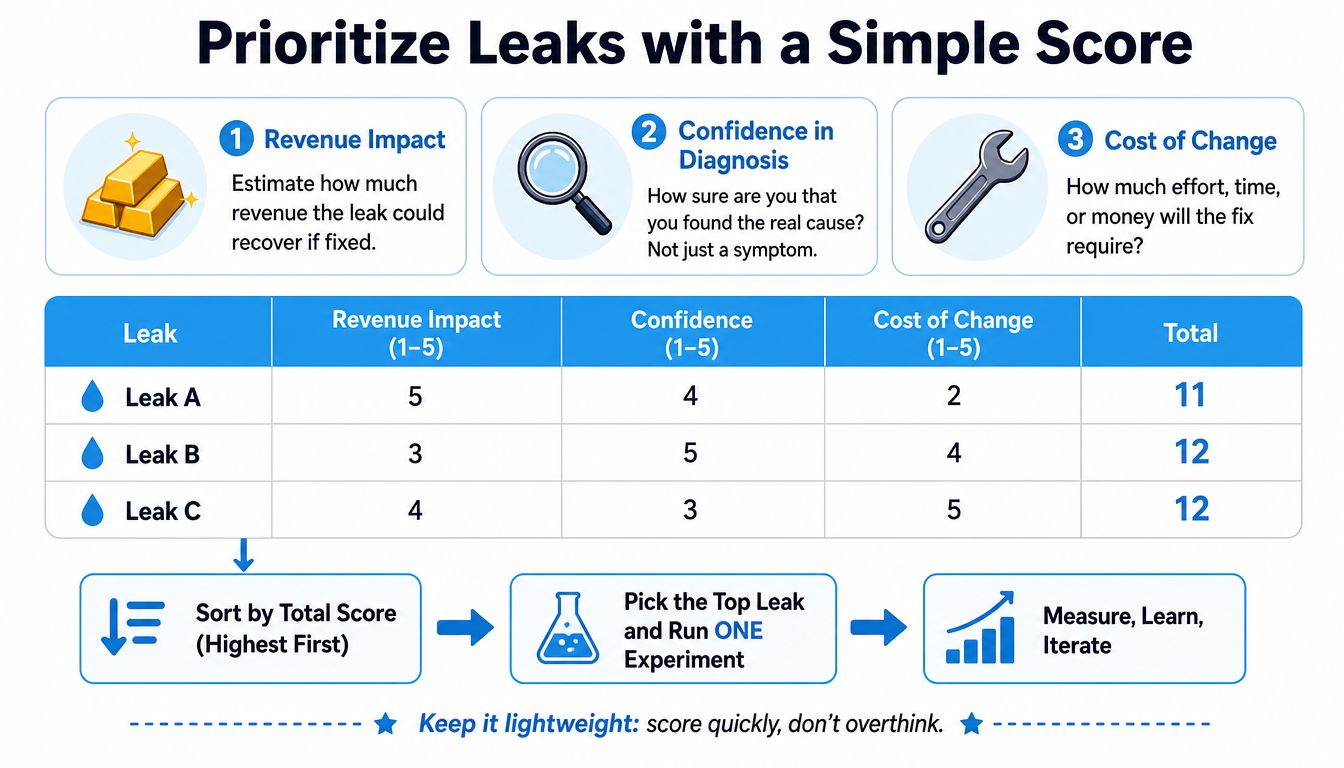
Revenue impact estimates the recoverable orders and margin if the diagnosis is correct. Confidence asks whether the evidence points to a cause rather than a symptom. Cost of change includes design, development, merchandising, legal review, app configuration, and operational complexity.
Turn the score into a disciplined test
Pick one primary KPI for the selected leak. Write a directional hypothesis that connects the observed friction to the proposed intervention, such as: “If mobile shoppers see delivery timing and returns information beside the purchase decision, product-view-to-cart rate should improve without reducing AOV.”
Then define:
- The audience: Include only the segment represented by the diagnosis.
- The variant: Change one meaningful element, such as layout, copy, offer framing, or trigger.
- The allocation: Set the traffic split before launch and don’t change it because an early result looks exciting.
- The decision rule: Choose the runtime and required evidence in advance.
- The guardrails: Monitor AOV, margin, refunds, cancellations, and downstream purchase rate.
Use the sample size calculation guidance to establish the test requirement before interpreting results. Don’t run five unrelated changes at once. You won’t know which change caused the movement, and interactions between changes can make a weak idea look strong.
Interpret gains with restraint
Segment the result by device and channel, then check whether the effect persists after novelty fades. A peak shopping day, campaign launch, or inventory event can distort the apparent outcome. Hold out a comparable audience or replicate the test before rolling the change across the store.
Behavior-driven promotions are legitimate experiments when they address a diagnosed decision problem. Test a cart-value incentive against a blanket discount, an exit-intent bundle against a generic popup, or a repeat-buyer nudge against a broad campaign. Scarcity bias can make a time- or quantity-bound reward more motivating, while loss aversion can make a shopper act to avoid missing a current benefit. The offer still needs margin guardrails and truthful availability.
From Experiment to Repeatable Playbook
A winning experiment has limited value if the next operator can’t reproduce it. Document the reasoning while the test is fresh, then turn the result into a playbook entry that connects the audience, trigger, experience, and financial guardrails.
Behavior-driven promotions deserve a different place in that playbook from generic site-wide sales. A blanket sale tells every shopper the price is negotiable and gives patient customers a reason to wait. A targeted exit-intent bundle, replenishment nudge, or post-add-to-cart upsell can respond to a specific behavior while protecting the value of products that don’t need a discount.
Scarcity bias explains why a capped reward can encourage action. Commitment and consistency can support a follow-up offer after a shopper has already added an item. Temporal discounting helps explain why an immediate benefit can outweigh a larger but uncertain future benefit. These principles work best when the experience is clear and the limitation is real, not when a timer resets every time a visitor refreshes the page.
What belongs in each playbook entry
- Hypothesis: State the diagnosed friction and the expected stage movement.
- Audience segment: Record device, channel, customer type, product group, and eligibility rules.
- Asset checklist: Include theme changes, product copy, creative, email or SMS messages, and tracking events.
- Launch steps: Document Shopify configuration, app settings, QA checks, and campaign timing.
- Guardrails: Record margin floors, inventory limits, AOV requirements, refund monitoring, and brand rules.
- Rollback trigger: Define the condition that stops the experience before the team rationalizes a weak result.
Review the playbook on a rolling 30-day cadence, comparing funnel metrics, experiment outcomes, promotion performance, and margin. The cadence should produce the next hypothesis, not another passive dashboard. Winning patterns can become reusable campaigns, while failed tests should remain documented so the team doesn’t repeat them under a new name.
The immediate next step is concrete. Pull your Shopify funnel, identify the highest-value leak after segmentation, run one validated test, and record the result in the template above. If the test works, make it operational. If it fails, preserve the learning and choose the next diagnosis instead of reverting to deeper blanket discounts.
Quikly gives Shopify brands a way to test behavior-driven promotional experiences using rewards constrained by time, quantity, or both, rather than relying only on automatic site-wide discounts. Its on-brand experiences can run across the storefront, email, social, and SMS, with mechanics refined across more than 60 million consumer interactions and a reported roughly 20% profit lift for Jordan Craig (Quikly).
Topics: conversion funnel analysis, Shopify CRO, funnel optimization, ecommerce metrics