A promotion can increase orders while making each order less valuable. That’s the uncomfortable reality behind many Shopify growth reports. Traffic rises, conversion looks healthy, and revenue moves in the right direction, but deeper discounts, smaller baskets, and weaker full-price demand steadily pressure the business.
That’s why AOV, or average order value, deserves more attention than a single conversion-rate result. If you’re asking, “what does AOV mean in business?”, the short answer is simple: it measures the average revenue generated by each completed order. The practical answer is more useful: it helps you judge whether your campaigns are creating valuable purchases or merely subsidizing them.
Why AOV Matters More Than Conversion Rate
A Shopify merchant launches a sitewide promotion. Orders come in quickly, the conversion rate improves, and the campaign looks successful in the first dashboard review. Then the finance team checks the margin. Customers bought, but many purchased only the lowest-priced item, and the discount applied across the entire basket.
The campaign generated activity. It didn’t necessarily generate healthy growth.
Conversion rate tells you how often visitors become buyers. AOV tells you what each completed purchase is worth. You need both metrics because a store can improve one while weakening the other. More conversions at a lower order value may increase top-line revenue but leave less money available for fulfillment, acquisition, returns, and future growth.
The definition in this practical guide to what is average order value is useful because it keeps the focus on the transaction rather than on general customer engagement. AOV doesn’t measure how loyal a buyer is or how often they’ll return. It measures the economic value of the order that just happened.

Revenue quality matters
AOV becomes especially important when promotion fatigue starts affecting customer behavior. If shoppers learn that your brand regularly offers blanket discounts, they may delay purchases and wait for the next markdown. That pattern can reduce perceived value even when individual campaigns produce short-term volume.
A stronger reading of campaign performance asks three questions:
- Did conversion improve? Did more visitors complete a purchase?
- Did AOV improve? Did each order contain more value?
- Did margin hold? Did the added basket value justify the discount and fulfillment cost?
Your conversion rate analysis should sit beside AOV, not replace it. A conversion-first dashboard can reward campaigns that acquire low-value orders. An AOV-only dashboard can reward excessive discounting. The useful decision comes from reading both alongside contribution margin and customer mix.
Practical rule: A promotion is stronger when it earns more valuable orders without teaching customers that full price is optional.
What AOV Means and How to Calculate It
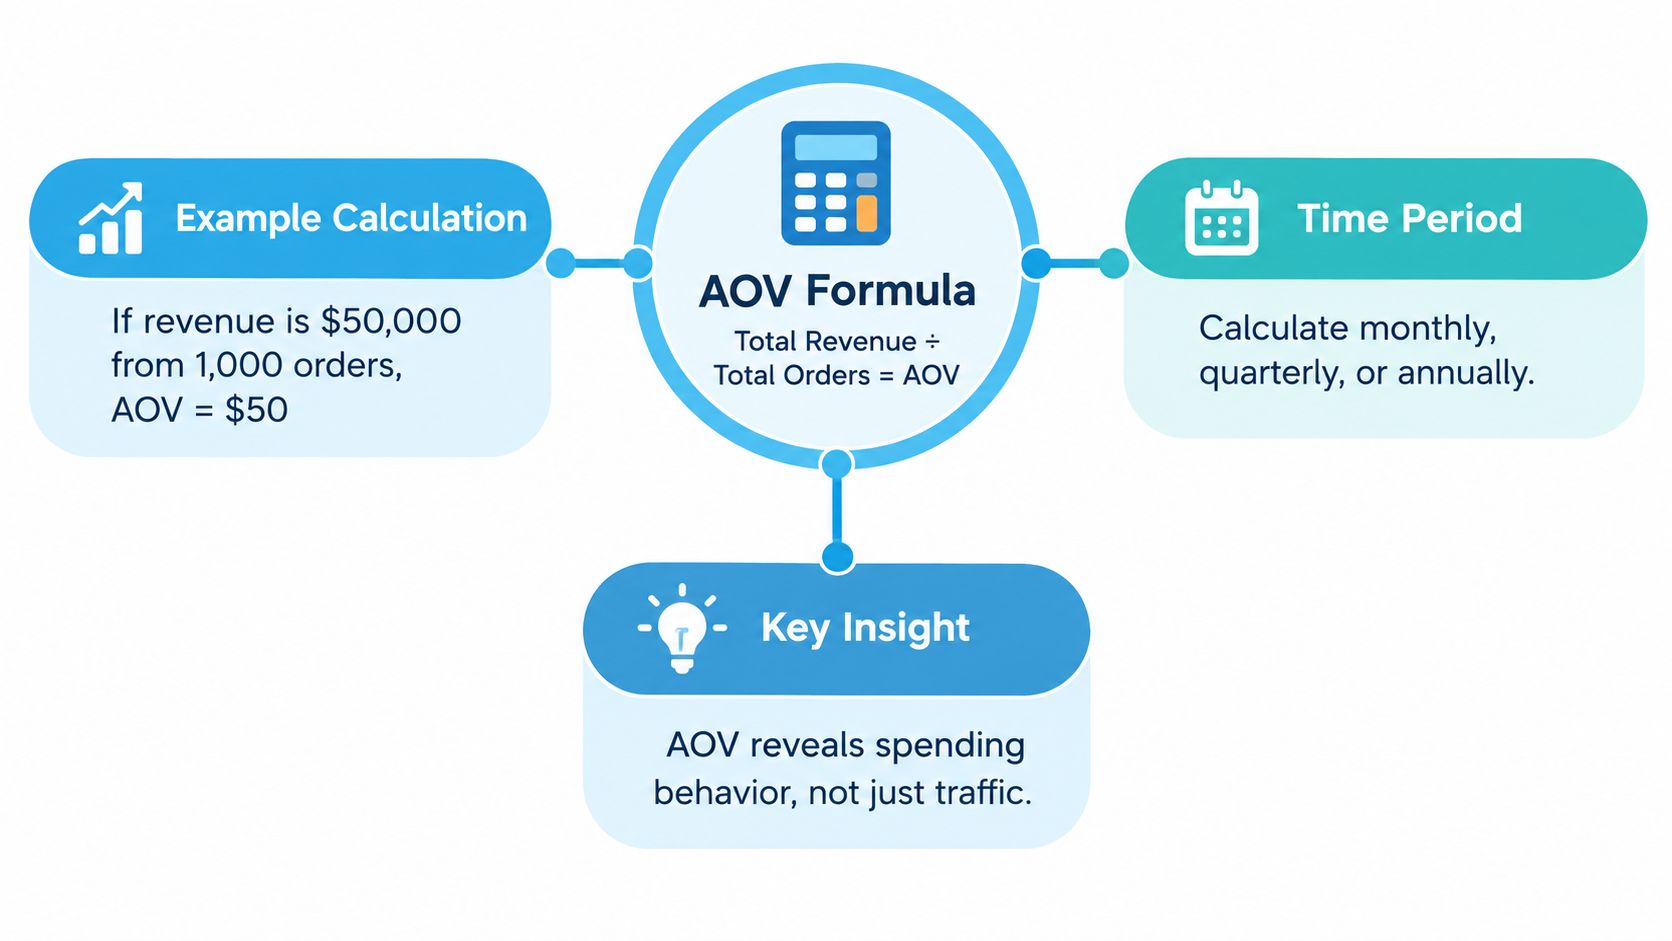
Average order value is total revenue divided by total orders during the same period.
The formula is:
AOV = Total revenue ÷ Total number of orders
If a store produces $200,000 in revenue from 8,000 orders, its AOV is $25. Salesforce provides this same calculation in its explanation of average order value and the AOV formula. The result answers one narrow question: how much revenue does each completed checkout generate on average?
Calculate it consistently
For a Shopify store, start by choosing a defined period, such as a month, campaign window, or product launch. Pull the revenue and order totals for that exact period, then divide revenue by orders. Keep the inputs consistent when comparing one period with another.
A store-level calculation should use the total order value and total order count for the period, rather than averaging separate monthly AOV figures. That methodology matters because monthly averages can distort the historical picture when order volumes differ. Portfolio IQ’s AOV benchmark guidance specifically highlights calculating across all orders in the period.
AOV is not customer lifetime value, and it isn’t average revenue per visitor. A customer who places multiple orders contributes multiple transactions to AOV. The metric also doesn’t tell you whether the purchase happened at full margin, through a bundle, or after a heavy discount.
That limitation makes AOV useful, not useless. It gives you a clean starting signal for checking pricing, merchandising, and promotional mechanics. The interpretation comes from adding context around the number.
The Operational Reality of AOV for Shopify Stores
A campaign can lift conversions and lower AOV at the same time. That is not automatically a problem. A discount-led acquisition campaign may bring in valuable new customers through a low-priced product, while a bundle may raise AOV by adding complementary items. The commercial question is whether the extra revenue supports margin and fits the brand promise.
AOV is an order-level metric, not a customer-level metric. It measures the value of each checkout, so traffic can remain flat while AOV rises, or conversion can improve while AOV falls. The figure describes what shoppers bought, not why they bought it or whether the order was profitable.
Store data supplies that context. Compare basket value across the factors that change purchase behavior:
- Promotion type: Separate bundles, free-gift thresholds, automatic discounts, and urgency campaigns.
- Product category: Review categories with different price points and margin structures.
- Traffic source: Paid social, email, SMS, organic search, and direct traffic often bring different purchase intent.
- Device: Compare mobile, desktop, and tablet orders to identify merchandising or checkout differences.
- Customer status: New and returning buyers may react differently to the same incentive.
A generic target can mislead because geography and device affect the comparison. One 2026 benchmark reported global AOV at $172, with EMEA at $193, the Americas at $158, APAC at $125, desktop at $218, mobile at $159, and tablet at $154. Salesforce’s average order value benchmark resource provides those figures. Use them as context, not as a reason to copy another store’s target.
A falling mobile AOV during a campaign, alongside stable desktop AOV, points toward a mobile-specific issue. Check product presentation, offer visibility, and checkout friction before extending a larger discount to every shopper.
A rising AOV can hide margin pressure when shoppers choose a higher-priced product only because it is heavily discounted. Track AOV with average discount depth, refunds, product margin, and conversion. The Shopify AOV measurement guide provides a framework for connecting the metric to store operations. That connection protects both campaign economics and brand perception.
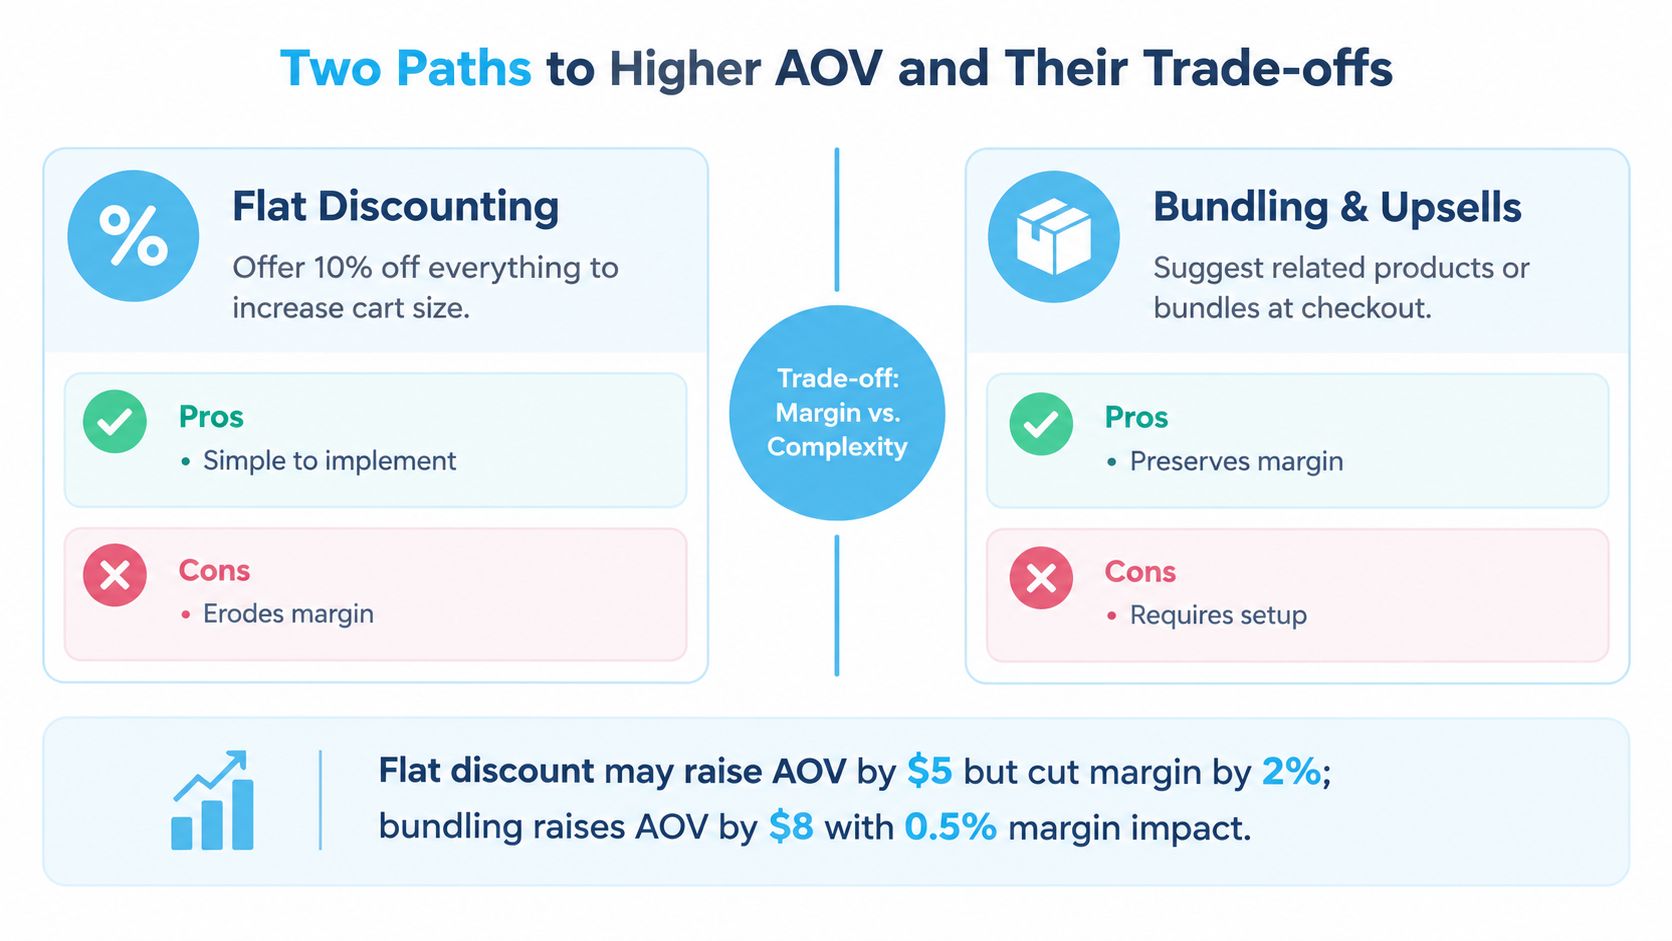
Two Paths to Higher AOV and Their Trade-offs
Merchants usually reach for one of two paths when they want larger baskets.
The first is flat discounting. A store reduces prices across a broad assortment and hopes customers add more products while the offer is active. This approach is easy to launch through Shopify’s discount infrastructure, familiar to shoppers, and capable of creating immediate demand.
Its weakness is structural. The discount applies to purchases that might have happened anyway, and repeated use can train customers to wait. It can also lower the perceived value of the catalogue, especially when the brand communicates sale pricing more often than product benefits.
The second path uses merchandising and behavior-driven incentives. Bundles, relevant cross-sells, product upgrades, free-gift thresholds, and time or quantity limits give shoppers a reason to build a larger basket without reducing every item’s price. The incentive is connected to a behavior, such as adding a complementary product or acting while an offer remains available.
Compare the economics
| Approach | What it can improve | What can go wrong |
|---|---|---|
| Flat discounting | Simple campaign setup and broad reach | Margin erosion and sale dependency |
| Bundles and upsells | Basket size and product relevance | Poor recommendations can reduce trust |
| Threshold incentives | Order value tied to a clear goal | A threshold set too high may reduce conversion |
| Time or quantity limits | Immediate decision-making | Artificial pressure can damage credibility |
The best choice depends on your catalogue and margin structure. A complementary product recommendation can feel helpful because it solves a real use case. An irrelevant upsell feels like friction. A discount that applies only after a shopper reaches a meaningful basket value can protect economics better than a blanket offer, but the threshold still has to feel attainable.
The behavioral principle is scarcity bias. Limited availability can make a decision feel more valuable, while temporal discounting explains why shoppers may act now when the benefit is clear and immediate. These mechanics work best when the limit is real and the offer is presented as an experience, not a manufactured countdown layered over every page.
A higher AOV is a win only when the added order value is worth more than the discount, cost, and brand damage required to create it.
Benchmarking AOV Against Real-World Data
AOV benchmarks can frame a campaign decision, but they cannot tell you whether your store’s current basket is healthy. Category, price architecture, region, device mix, and promotion strategy all shape the result. The useful comparison is your own baseline, adjusted for channel and campaign.
A benchmark report covering 2,934 active Shopify stores found a H1 2026 median AOV of $312, a cohort mean of $607, and a middle 50% range of $159 to $667. The Portfolio IQ benchmark puts those figures in context. The gap between the median, mean, and middle range shows how a smaller group of large purchases can pull the average upward. A store near the mean is not automatically outperforming one near the median.
Use market figures as context
One 2026 benchmark placed global ecommerce AOV at about $172. Another summary reported a global average near $150, rising to $154 in October 2025, a 3.08% year-over-year increase. Speed Commerce’s ecommerce AOV benchmark coverage collects those market figures. They help establish scale, but a Shopify brand should not copy a market average when its price points, shipping costs, and margins differ.
A U.S. ecommerce benchmark cited by Klipfolio’s order value guide places typical online retail order value around $78. The contrast with broader global figures makes the operating lesson clear: category, geography, sample, and calculation method change the benchmark.
Judge the quality of the increase
A higher AOV may reflect relevant add-ons, premium variants, or bundles that improve the customer’s purchase. It may also come from price increases, an inflated free-shipping threshold, or a deeper discount that leaves less contribution margin and teaches customers to wait for promotions.
Review each campaign through four questions:
- Basket behavior: Are shoppers adding products that fit the original purchase, or choosing a discounted higher-priced item?
- Margin behavior: Does contribution margin hold after discounts, shipping, and fulfillment?
- Customer behavior: Are bargain-seeking customers replacing repeat buyers or adding to the customer base?
- Channel behavior: Does the increase appear in email and SMS, paid traffic, or every source?
Place AOV beside conversion, acquisition, and profitability using this ecommerce performance metrics framework. A sound increase supports the business model and the brand’s value signal. A cosmetic increase improves the dashboard while weakening the economics behind it.
Using AOV as a Strategic Lever for Growth
AOV becomes strategically valuable when it changes the question from “How do we get more orders?” to “How do we make each order more economically useful?”
That shift changes campaign design. Instead of applying a broad discount and judging success by order count, define the behavior you want. You might encourage a relevant bundle, reward a larger basket, promote a premium product with a clear value difference, or give earlier shoppers access to a better offer while availability lasts.
Review each campaign against four signals:
- AOV: Did the average checkout value move?
- Margin: Did the added value survive discounting and fulfillment costs?
- Conversion: Did the incentive help shoppers decide without creating excessive friction?
- Brand effect: Did the offer reinforce value or teach customers to wait for another sale?
AOV should be a diagnostic tool before it becomes a target. When it rises with stable margin, your merchandising and promotion are likely working together. When it rises while margin compresses, the campaign may be purchasing order value at an unsustainable price.
Quikly creates time- and quantity-bound promotional experiences for Shopify stores, including reward structures that encourage shoppers to act sooner rather than wait for a blanket discount. Visit Quikly to see how behavior-driven offers can support higher-value orders while keeping the margin and brand-perception trade-off visible.
Topics: AOV, average order value, ecommerce metrics, business analytics, online retail