A promotion experiment can look successful on the surface and still fail the moment someone asks a harder question: what exactly did we calculate the sample size to detect? A merchant may plan around conversion rate, collect orders, and then report profit per visitor, average order value, or incremental revenue as the decision metric. The traffic may be sufficient for one outcome and badly insufficient for another.
That mismatch is especially expensive for Shopify brands. A weak test can consume inventory, reduce margin, and encourage another round of deeper discounting without producing dependable insight. A sound sample size calculation starts before the formula, with a precise match between the business decision, the primary outcome, and the variable used in the calculation.
The Hidden Error That Invalidates Your Promotions
A merchant launches a limited promotion with control and treatment groups. After the campaign, the treatment group records more orders, so the team calls it a win. Finance then reviews contribution profit, or an analyst checks average order value, and the conclusion becomes uncertain. The problem may sit in the test design, not the offer or traffic.
The structural error is outcome variable mismatch. A sample size calculated for conversion proportion does not automatically support a final report based on mean profit per visitor. The same issue appears when a team calculates for clicks but decides based on completed purchases, or calculates for revenue while the commercial constraint is margin.
Practical rule: The metric used in the sample size calculation must match the primary outcome you will analyze and use for the decision.
Start by matching the primary outcome to the variable used in the calculation. Then specify the significance level, target power, effect size, and an appropriate dropout rate. The sample size methodology guidance from the National Library of Medicine identifies this alignment as a core requirement.
Why the mismatch matters commercially
A conversion-rate test can have enough observations for its planned outcome while a profit analysis remains noisy. A promotion may increase orders but reduce contribution per order, especially when discounts encourage shoppers to wait for the next markdown. If the calculation ignores the outcome that protects margin, the test can reward behavior that looks positive in a dashboard while weakening commercial performance.
Urgency campaigns create the same risk. A merchant may need to know whether a time-bound offer produces incremental purchases, not just whether exposed visitors interact with it. The analysis must separate the business action that matters from the event that is easiest to count. Shopify analytics and e-commerce measurement guidance, theme events, discount reporting, and Klaviyo or SMS engagement data can all help, but they do not automatically answer the same question.
Write the measurement decision before sending traffic. Name the primary outcome, analysis unit, comparison, and smallest commercially meaningful effect in one sentence. That statement exposes whether the calculation inputs match the result the promotion must prove. A clean alignment at this stage prevents invalid conclusions after the campaign has already spent traffic, margin, and time.
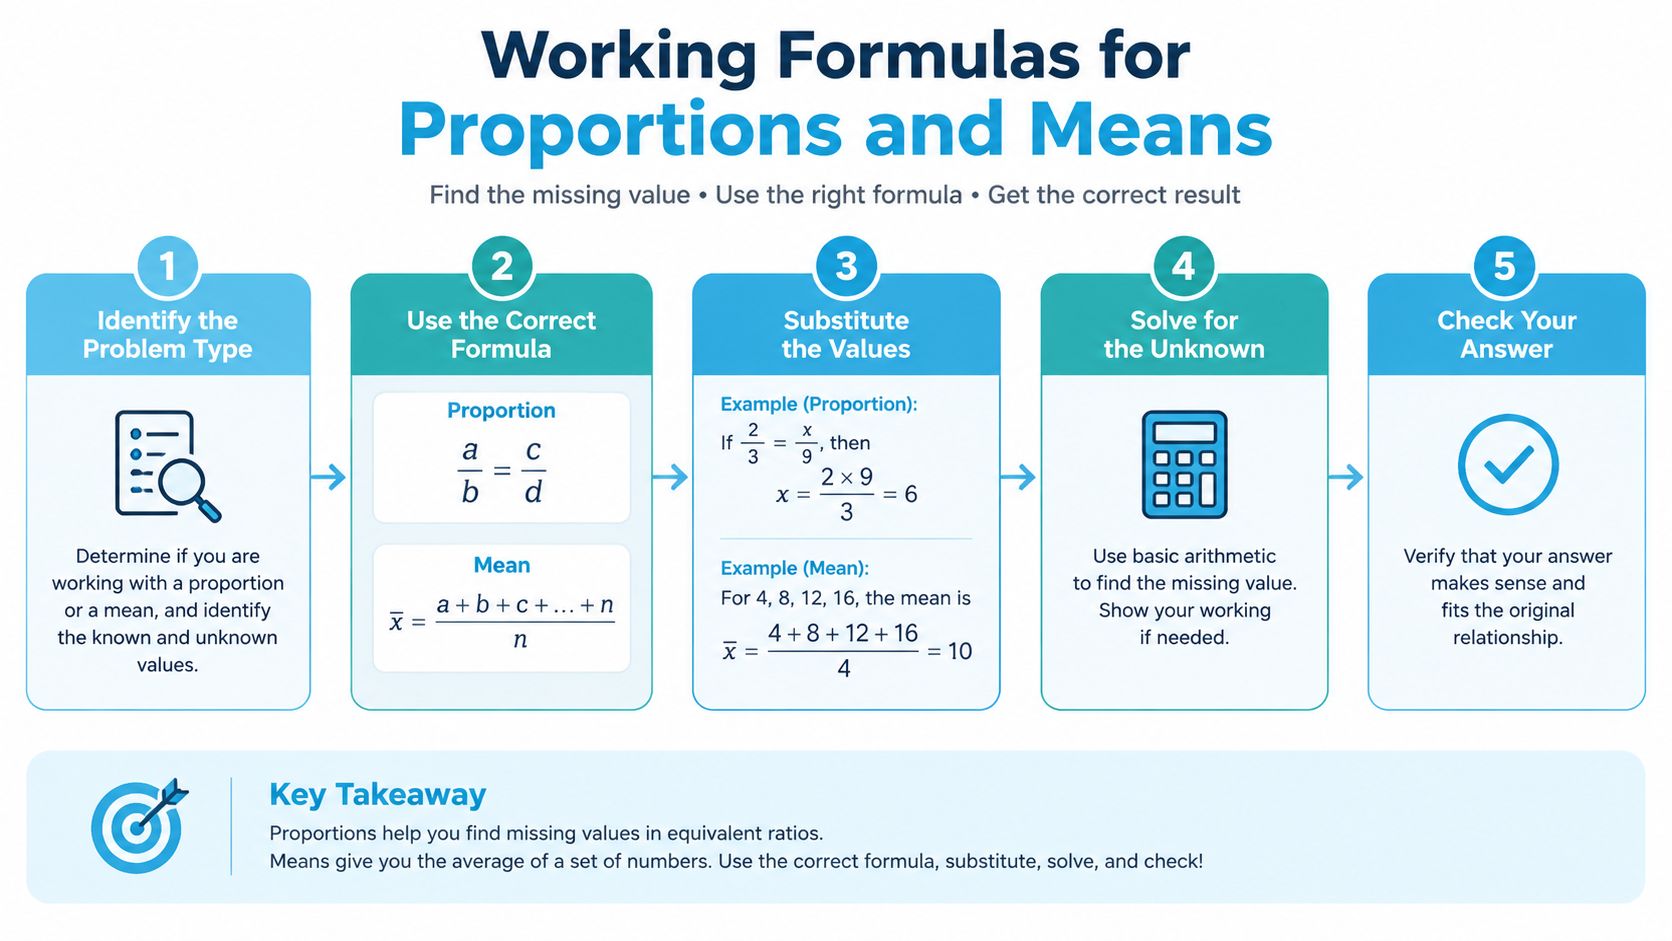
Working Formulas for Proportions and Means
Promotion tests usually measure one of two outcome types. A proportion records whether an event occurred, such as a purchase or signup. A mean summarizes a continuous result, such as average order value, profit per visitor, or revenue per session. The formula must match the outcome that determines the decision.
For a proportion test, set the inputs in this order:
- Define the baseline proportion. Use the current conversion rate for the same audience, device mix, traffic source, and offer context. A baseline from another landing page or season may produce a neat calculation while misrepresenting current traffic.
- Set the smallest detectable effect. Specify the change that would justify launching the promotion. A small lift may be statistically detectable yet fail to cover discount or operating costs.
- Choose significance and power. A commonly used design sets 80% power with a two-sided 0.05 significance level. Lower false-positive tolerance or higher detection requirements generally increases the needed sample.
- Calculate per group, then adjust for loss. The output represents usable observations, not every session assigned to the test. Account for bot traffic, duplicate events, and unusable records in the analysis plan.
The proportion formula captures the relationship among baseline variability, target effect, significance, and power. Lower baseline conversion or a smaller effect usually requires more observations. Do not accept a calculator’s default input without checking its commercial meaning.
For a mean test, variability becomes the additional input. Estimate the standard deviation or variance of the metric you will analyze. Average order value with a few unusually large orders can vary widely, so detecting a modest difference may require far more observations than a tightly clustered metric.
A precision-based calculation answers a different question from a power-based comparison. Precision targets use the margin of error as half the confidence-interval width, and standard proportion or mean formulas grow as that margin becomes narrower. Requiring a tighter interval can therefore increase the sample rapidly. The StatPrimer sample-size guide explains this relationship and the corresponding formulas.
Document every assumption in a spreadsheet, including the primary outcome, analysis unit, baseline, effect, and expected exclusions. Then validate the result with an appropriate calculator or statistical package. A correct formula cannot rescue inputs that describe a different outcome from the one used to judge the promotion.
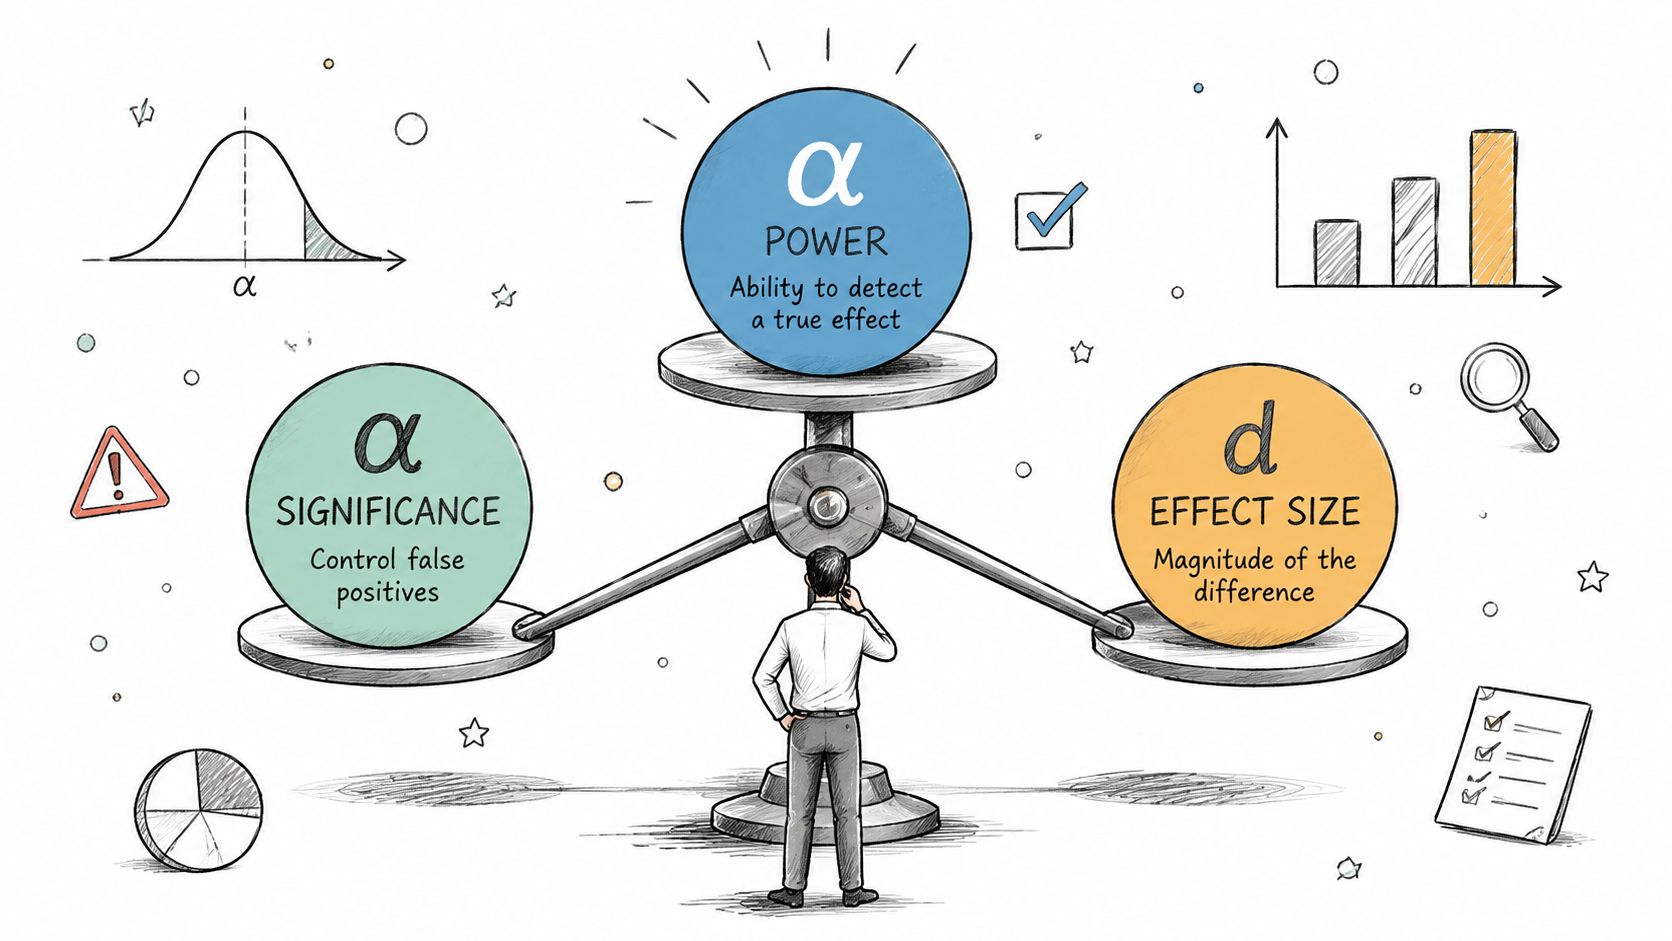
Navigating Power, Significance, and Effect Size Trade-offs
Sample size isn’t a neutral output. It reflects the risks you’re willing to accept and the commercial effect you care enough to detect.
Significance level controls how conservative the test is about false positives. A lower threshold makes it harder to declare a result, which generally requires more observations. Power describes the chance of detecting an effect that really exists. Raising the target power also increases the required sample because the test must distinguish signal from random variation more reliably.
Effect size is the commercial lever. If you ask the test to detect a smaller change, the sample requirement expands. The trade-off is useful when an effect could materially change profit, but wasteful when the detectable difference is smaller than the cost of acting on it.
Translate statistical choices into promotion economics
Suppose a merchant is comparing a standard discount with a more time-bound offer. The analyst shouldn’t ask only whether the treatment can produce a statistically significant conversion difference. The better question is whether the detectable difference is large enough to offset:
- Discount cost, including the value surrendered on orders that would have happened anyway.
- Contribution margin, which may vary by product, channel, and customer type.
- Operational capacity, such as inventory availability, fulfillment load, and customer service demand.
- Brand cost, especially if repeated promotions teach customers to delay purchases.
A perfectly significant result can still support a bad decision. If the offer needs aggressive discounting to create a detectable effect, the experiment may validate a tactic that harms profitability or perceived value. Conversion is useful only when it survives the margin conversation.
The right sample size protects the decision, not the p-value.
A practical design should state the acceptable false-positive risk, the desired detection probability, and the smallest effect that would change campaign policy. If the resulting traffic requirement exceeds what the store can collect during a stable period, change the design before launch. Narrow the audience, simplify the comparison, accept a larger effect threshold, or choose a different outcome that better matches the decision.
Handling Uncertainty in Baseline Assumptions
A sample size formula can produce a precise number from uncertain inputs. Baseline conversion, variance, expected effect, and attrition may change with audience mix, device, season, creative, assortment, or promotion mechanics. The calculation is only as credible as its alignment with the outcome and population you will measure.
A stale baseline creates two risks. An optimistic rate can leave the test underpowered, so a meaningful effect remains hard to detect. A pessimistic rate or inflated variance can demand unnecessary traffic and margin. Check earlier estimates against the current audience and outcome instead of copying them unchanged.
Treat uncertainty as an input
Document a plausible range, not one preferred value. Recalculate under conservative and optimistic assumptions, then identify the scenario that sets the operational plan. If the required sample shifts materially, record that sensitivity before launch.
Keep the primary outcome aligned with every calculation input. If the decision concerns completed purchases, do not size the study from add-to-cart behavior unless that is the stated outcome. A stable baseline for the wrong metric still produces a misleading sample size.
Precision and power answer different questions. Precision sets how narrow the estimate should be. Power sets whether the test can detect a defined difference. Tighter precision usually requires more observations because the calculation responds strongly to the squared margin of error. “Enough to be safe” has no operational meaning until safety is tied to a decision threshold.
Bayesian and adaptive methods can represent uncertainty and, in some designs, allow sample-size re-estimation during a trial. They also bring additional assumptions and trade-offs. The 2026 Bayesian design paper reports a trade-off between smaller expected samples and substantially lower power, while a review discussed there found that Bayesian methods remain a small share of published sample-size reporting. A smaller plan can therefore carry meaningful detection risk.
For Shopify experiments, a controlled pilot can test instrumentation, eligibility, baseline behavior, and outcome distribution before a larger rollout. Use a promotion pilot calculator for planning, then update its inputs when the pilot reveals a different customer mix or primary outcome. Keep those assumptions visible in the launch record, so the final sample reflects the decision you will make.
Why Aggregate Sample Sizes Can Mislead Subgroup Analysis
An overall result can be clear while every segment-level conclusion remains uncertain. This happens when the calculation targets the combined population but the team later compares new customers with returning customers, mobile shoppers with desktop shoppers, or high-value buyers with low-frequency visitors.
The aggregate sample is divided across those groups, and each subgroup inherits its own variability. A segment with fewer observations has less stable estimates, even when the total experiment appears large. Uneven allocation makes the problem worse because one segment may dominate the overall result while another contributes too little information for a reliable decision.
Decide the segment question before launch
The sample size should reflect the analysis you intend to publish, not the analysis you hope the data will support afterward. If the promotion is expected to work differently for first-time customers and repeat buyers, define that interaction in advance. If the segment comparison is only exploratory, label it that way and avoid presenting a noisy subgroup pattern as a confirmed finding.
The randomized-trial reporting research highlights inconsistent explanation of sample size calculations, while related guidance on survey mistakes points out that a total sample can look adequate even when each subgroup is too small. That is a reporting problem and a planning problem.
A total sample answers the aggregate question. It doesn’t automatically fund every question you may ask later.
A better design starts with the decision hierarchy:
- Primary decision: Determine the overall effect using the preselected primary outcome.
- Required subgroup decisions: Size and allocate traffic for segments that could change the rollout decision.
- Exploratory cuts: Report directionally, with uncertainty made explicit, rather than treating them as definitive.
- Operational segmentation: Use Shopify customer tags, purchase history, or Klaviyo properties only when the segment definition is stable and applied consistently across groups.
If segment insight is central, consider stratified assignment or separate tests instead of hoping random traffic will distribute cleanly. Incrementality work should also distinguish observed purchases from purchases caused by the promotion. A resource on incrementality testing for promotional decisions can help frame that distinction before the audience is split into subgroups.
Defining the Smallest Effect Worth Detecting
Start with the business constraint, not the calculator.
The minimum detectable effect should represent the smallest change that would justify launching, extending, or replacing the promotion. For a merchant, that may be a profit-per-visitor improvement large enough to cover the incentive, or a conversion improvement that remains acceptable after accounting for discount cost. The threshold depends on the decision, not on what produces a convenient sample size.
Build the threshold from commercial reality
Write down the conditions that make a promotion viable:
- Margin floor: Identify the lowest acceptable contribution after discounting, returns, fulfillment, and channel costs.
- Customer value: Consider whether the audience has a credible path to repeat purchase, without treating uncertain future value as guaranteed revenue.
- Capacity limit: Account for inventory, fulfillment, and support constraints. A promotion that exceeds operational capacity isn’t a successful experiment.
- Decision rule: State what result would lead to rollout, revision, or abandonment.
This process prevents a common failure mode: designing a study to detect an arbitrarily small lift that cannot change the operating plan. A tiny effect may be statistically interesting and commercially irrelevant. It can also encourage teams to keep discounting until the dashboard produces a favorable result, worsening margin erosion and teaching customers to wait.
The threshold should match the primary outcome. If the business decision concerns profit, calculate around profit. If the decision concerns average order value, use a mean-based design with a defensible variability estimate. If the decision concerns purchase incidence, use a proportion-based design. Don’t calculate around conversion because it is familiar and then switch to revenue in the final report.
A strong effect-size statement sounds operational: “We would act only if the offer improves the selected profit outcome enough to justify its cost under the planned audience and execution.” Once that statement is approved, the statistical calculation becomes a validation tool. It tells you how much evidence the decision requires and whether the proposed test is feasible without sacrificing the economics the promotion is supposed to improve.
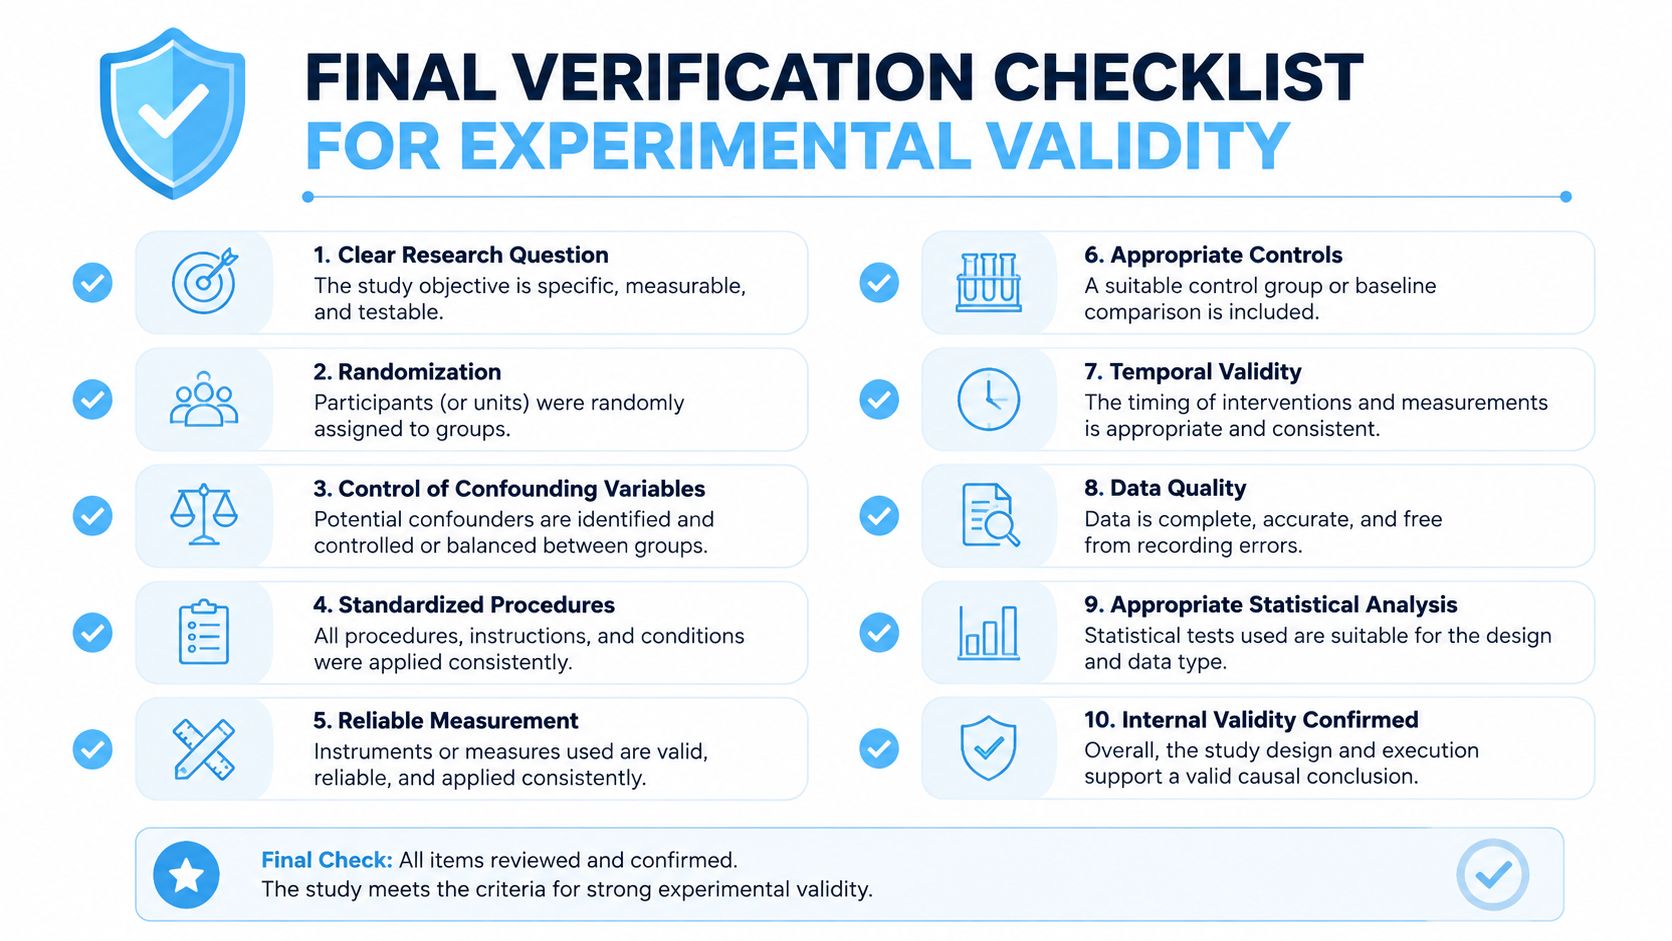
Final Verification Checklist for Experimental Validity
Before launching, treat the sample size calculation as a quality gate. The following checks catch errors that a calculator can’t detect:
- Primary outcome: Confirm the final report will analyze the same variable used in the calculation.
- Analysis unit: Specify whether an observation is a visitor, session, customer, order, or another defined unit.
- Baseline: Use current, context-specific data rather than an attractive historical benchmark.
- Effect size: Tie the smallest detectable effect to margin and the actual rollout decision.
- Significance: Record the selected alpha and explain the false-positive risk it represents.
- Power: Record the target power and acknowledge what a missed effect would mean.
- Variability: Use an appropriate estimate for means, rates, or other endpoint types.
- Attrition: Account for exclusions, incomplete tracking, invalid traffic, and expected data loss.
- Traffic feasibility: Check that the store can reach the required analyzable sample during a comparable trading period.
- Subgroups: Size important segments separately or label their results exploratory.
Keep the assumptions in the experiment brief, including the formula, data source, date of the baseline, assignment rules, stopping rule, and reporting method. If the calculation is outside your team’s statistical comfort zone, specialist support such as working with DigiVisi Ltd on CRO can add an independent review before traffic and margin are committed.
A rigorous sample size isn’t academic decoration. It ensures that the promotional dollars, customer attention, and inventory allocated to a test produce evidence you can act on.
Quikly helps Shopify merchants test urgency and scarcity promotions built around time-limited or quantity-limited rewards, rather than relying on deeper blanket discounts. Visit Quikly to see how behavior-driven offers can be planned around measurable outcomes while protecting margin and brand perception.
Topics: sample size calculation, experiment design, e-commerce testing, statistical power, A/B testing