Revenue is up. Orders look healthy. Shopify says the campaign worked.
Then finance asks a simple question: did profit improve, or did you just give away margin to customers who would’ve bought anyway?
That’s the point where most Shopify teams realize their reporting is too shallow. They can see sessions, sales, and discount code usage. They usually can’t see whether a promotion changed customer behavior in a way that was worth paying for.
That gap matters more now because the market for customer analytics in e-commerce is projected to grow from USD 14,921.2 million in 2025 to USD 49,221.3 million by 2035, at a 12.8% CAGR, which signals how aggressively brands are moving toward data-driven decision-making as traditional discounting produces weaker returns over time (Future Market Insights). The brands getting serious about analytics e commerce aren’t doing it because dashboards are fashionable. They’re doing it because promo fatigue is expensive.
The Hidden Cost of Unmeasured Promotions
A familiar Shopify scenario goes like this. A brand launches a weekend offer, sees a spike in revenue, and calls it a win by Monday morning. A week later, nobody can answer the harder questions.
Did the offer bring in new customers or only subsidize existing demand? Did average order value hold up, or did shoppers buy less because the discount did the heavy lifting? Did the campaign increase future purchase intent, or train more customers to wait?
Those aren’t edge-case questions. They’re basic operating questions. If your team can’t answer them, you’re not really measuring promotions. You’re measuring activity.
Why Shopify revenue reports aren’t enough
Shopify’s native reports are useful, but they rarely tell the full story on promotional efficiency. They can tell you what sold. They usually won’t tell you whether the promotion improved the quality of demand.
That distinction matters when margins are tight. A promotion that lifts top-line revenue can still hurt contribution if it lowers order quality, attracts only deal-seekers, or cannibalizes full-price purchases that were already likely to happen.
Practical rule: If a promotion report stops at revenue and redemptions, it isn’t finished.
What operators actually need to know
The useful analytics questions are more commercial than technical:
- Who converted: New customers, repeat buyers, or shoppers who already showed high intent
- What changed: Conversion rate, order value, checkout completion, and post-purchase behavior
- What it cost: Margin impact, not just discount volume
- What it trained: Whether customers now expect the next offer before purchasing
For analytics e commerce, the focus shifts from dashboards to control. Good measurement lets you separate real incremental demand from expensive noise. Without that, promotions become a habit, not a strategy.
Beyond Page Views What Is E-commerce Analytics
E-commerce analytics isn’t a traffic report. It’s the operating system for understanding how customer behavior turns into revenue, margin pressure, repeat purchases, or wasted ad spend.
A lot of Shopify merchants still treat analytics as a rearview mirror. They check sessions, top pages, and maybe conversion rate. Useful, but incomplete. The key is to connect acquisition, on-site behavior, offer exposure, checkout movement, and post-purchase value into one decision-making process.
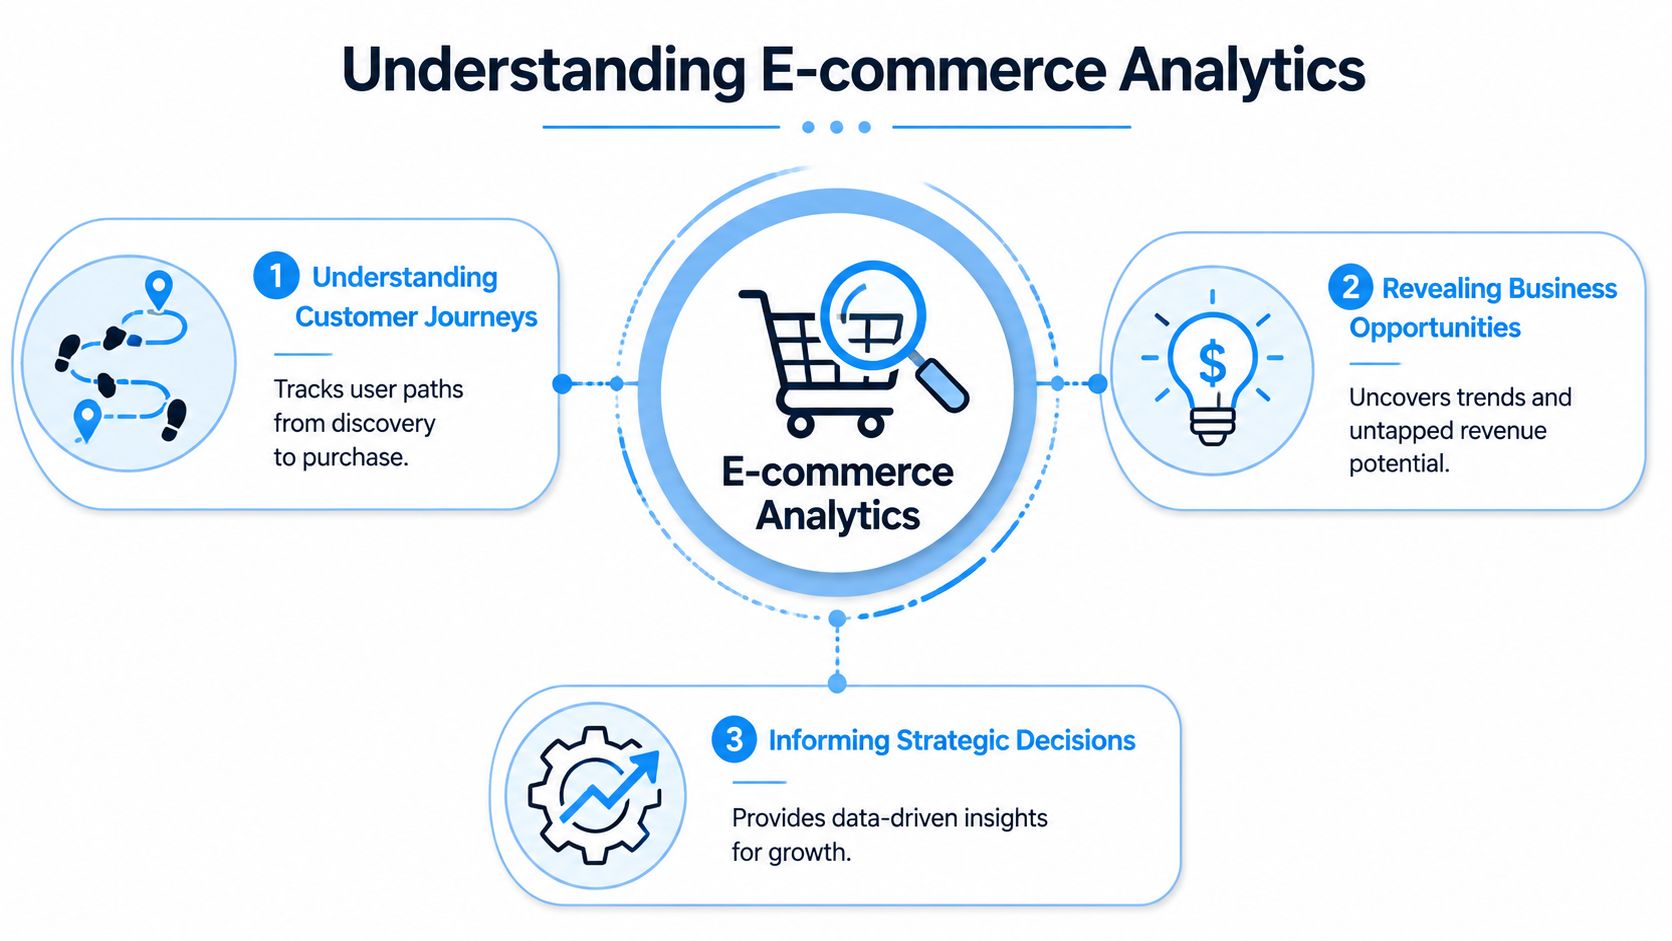
The useful definition
For a Shopify team, e-commerce analytics means tracking the customer journey well enough to answer commercial questions such as:
- Where intent starts: Paid social, email, SMS, search, direct, or affiliate traffic
- Where friction appears: Product pages, cart, shipping step, payment page, or mobile UX
- Where margin gets won or lost: Through order size, promotion design, and repeat behavior
- Where to act next: Which test deserves engineering time, media budget, or merchandising focus
Vanity metrics don’t do that. Page views can rise while profitability falls. Social engagement can climb while checkout abandonment stays ugly. A store can look busy and still underperform.
What robust analytics looks like on Shopify
A solid analytics e commerce setup connects a few layers that often live in separate tools:
| Layer | What it tells you | Common Shopify tools |
|---|---|---|
| Traffic acquisition | Which channels drive visits and intent | GA4, Meta Ads, Google Ads |
| Store behavior | What shoppers do on product, cart, and checkout paths | Shopify Analytics, heatmaps, session review tools |
| Promotion response | Who engaged with an offer and how behavior changed | Discount data, campaign tagging, app-level events |
| Retention outcomes | Whether acquired customers come back and buy profitably | Shopify customer reports, Klaviyo |
If your tracking foundation is shaky, everything built on top of it gets shaky too. That’s why teams revisiting analytics often start with basics like event naming, ecommerce events, attribution hygiene, and implementing Google Analytics 4 correctly before they try to interpret promotional performance.
Good analytics doesn’t answer “how much traffic did we get?” first. It answers “what behavior created profitable growth?”
The mental model that helps
Think of analytics as the link between customer psychology and commercial outcomes.
A shopper doesn’t move through your store as a spreadsheet row. They react to friction, relevance, urgency, trust, and perceived value. Analytics gives your team a way to observe those reactions in aggregate, then make better decisions about merchandising, offers, creative, and UX.
That’s the version of analytics e commerce that matters. Not more reports. Better decisions.
The Core Metrics That Actually Protect Your Margins
Analytics efforts often include tracking conversion rate, average order value, and lifetime value. Fewer teams use them as a system.
That’s the mistake. If you treat each metric in isolation, you’ll chase short-term gains that create long-term damage. The smarter approach is to read them together, because each one tells you something different about whether your store is growing efficiently or buying revenue with margin.
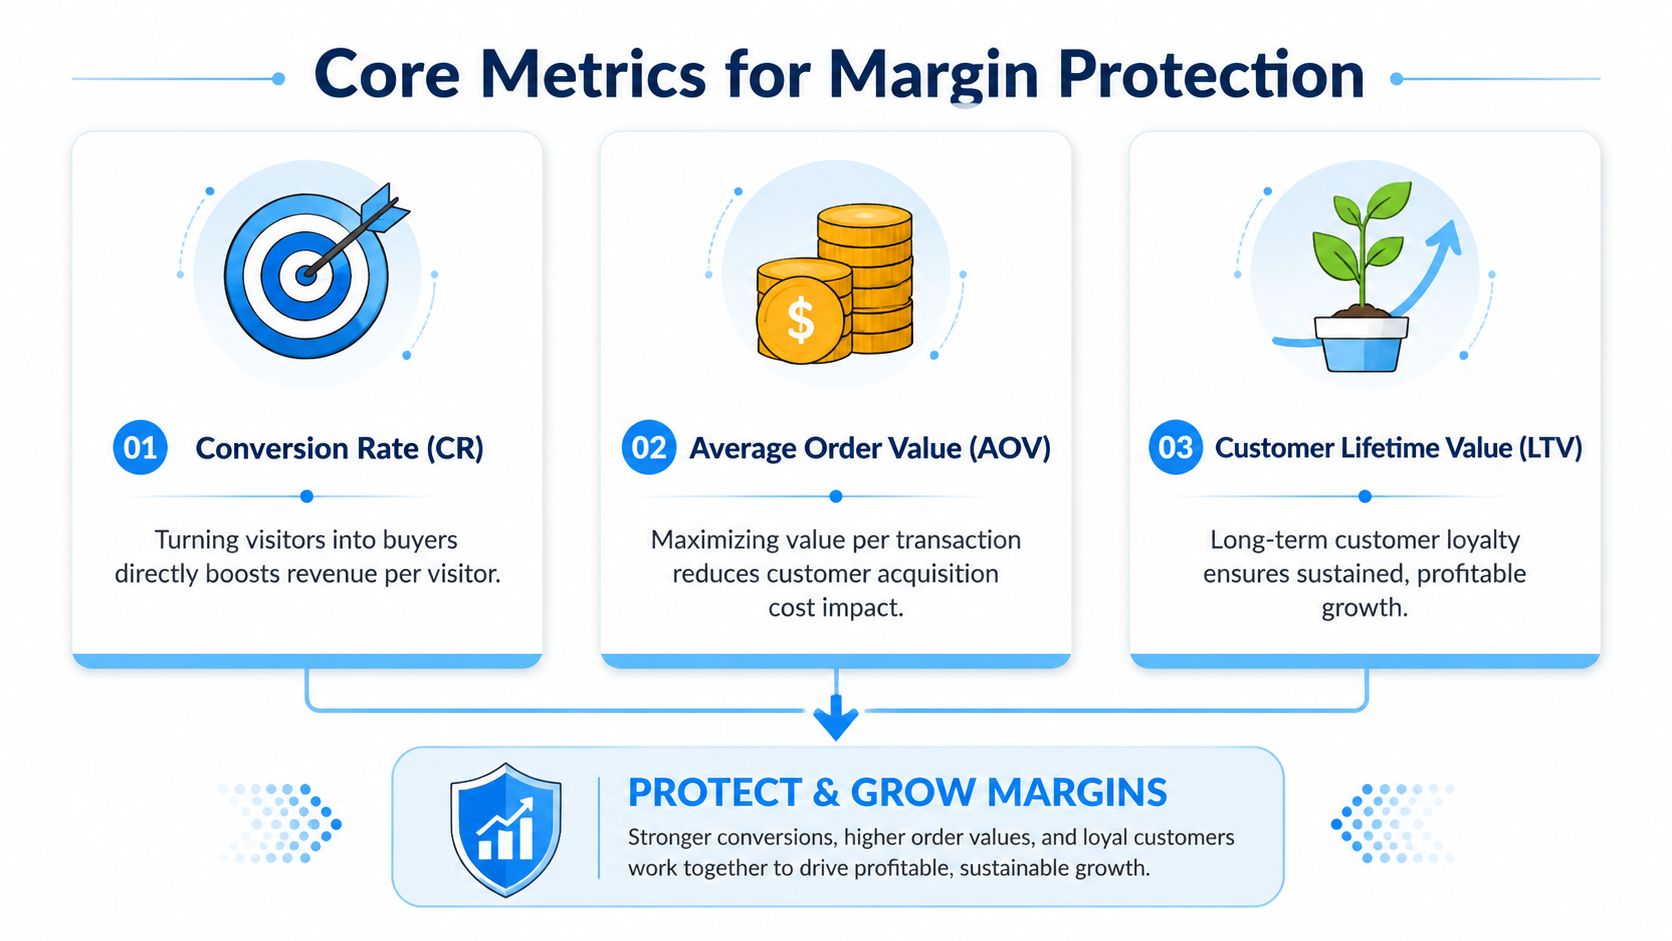
Conversion rate is a signal, not the goal
Conversion rate gets too much attention on its own because it’s easy to celebrate. But a higher conversion rate isn’t automatically a better business.
Across major markets, the average e-commerce conversion rate sits around 2.5% to 3.0%, while top performers reach 5% or higher and Amazon reaches 10% to 15% partly because of Prime behavior and unusually high purchase intent (Cimulate commerce statistics). Those benchmarks are useful, but only in context.
If you force conversion up with broad discounts, you may improve one metric while weakening order value and training customers to delay future purchases until the next sale.
AOV is where margin defense starts
Average order value matters because it gives you an advantage without automatically cutting price. Benchmark guidance from Nulogic notes that CAC has risen, and leading brands defend profitability by improving AOV, which is calculated as Total Revenue divided by Number of Orders. Increasing AOV directly helps offset the margin damage caused by discounts (Nulogic on ecommerce performance analysis).
Here’s the practical read:
- Low conversion and low AOV usually points to weak traffic quality or weak merchandising
- High conversion and falling AOV often means the offer is doing too much work
- Stable conversion and rising AOV is usually healthier growth
For a deeper framework on how Shopify teams track these relationships, Quikly’s guide to ecommerce performance metrics is worth reviewing.
LTV tells you whether your promotions are creating customers or just orders
Lifetime value is where promotional strategy gets exposed. A campaign can look efficient in the week it runs and still be a bad decision if it mostly acquires low-loyalty buyers who only shop on discount.
This is why smart teams compare customer groups over time. Not every converted customer is equally valuable. Some become repeat purchasers. Some disappear. Promotions that over-index on the second group can erode brand quality even when they help monthly revenue.
The best promotional metric stack doesn’t ask, “Did it convert?” It asks, “Did it convert the right customer at the right economics?”
Read the metrics together
A simple operating table helps:
| Metric | What it reveals | Margin warning sign |
|---|---|---|
| Conversion rate | Ability to turn traffic into orders | Rising only when discounts get broader |
| AOV | Value captured per transaction | Slipping as promo intensity rises |
| LTV | Quality of customers acquired | Discount-driven cohorts don’t return |
That’s the core discipline in analytics e commerce. You’re not collecting metrics because platforms make them available. You’re using them to stop bad growth from disguising itself as good growth.
Measuring and Optimizing Your Promotion Strategy
Most brands overestimate how well they understand promotions. They know which code was used. They know the campaign generated orders. They often don’t know whether the offer changed behavior or merely reduced price.
That difference is the line between strategy and leakage.
Discount code reporting is not promotion analysis
One of the biggest blind spots in analytics e commerce is confusing redemption data with customer understanding. Piwik PRO highlights a critical gap between tracking discount code usage and understanding price sensitivity. Without knowing which segments wait for deals and which are willing to buy full-price, brands fall into one-size-fits-all discounting that teaches customers to hold out for the next sale (Piwik PRO on ecommerce analytics).
That pattern creates two predictable problems:
- Cannibalization: You discount orders that likely would’ve happened anyway
- Conditioning: You train buyers to anchor on promotions instead of value
A lot of teams call this “promotional success” because the code was used heavily. Heavy use isn’t the same as incremental profit.
What to measure instead
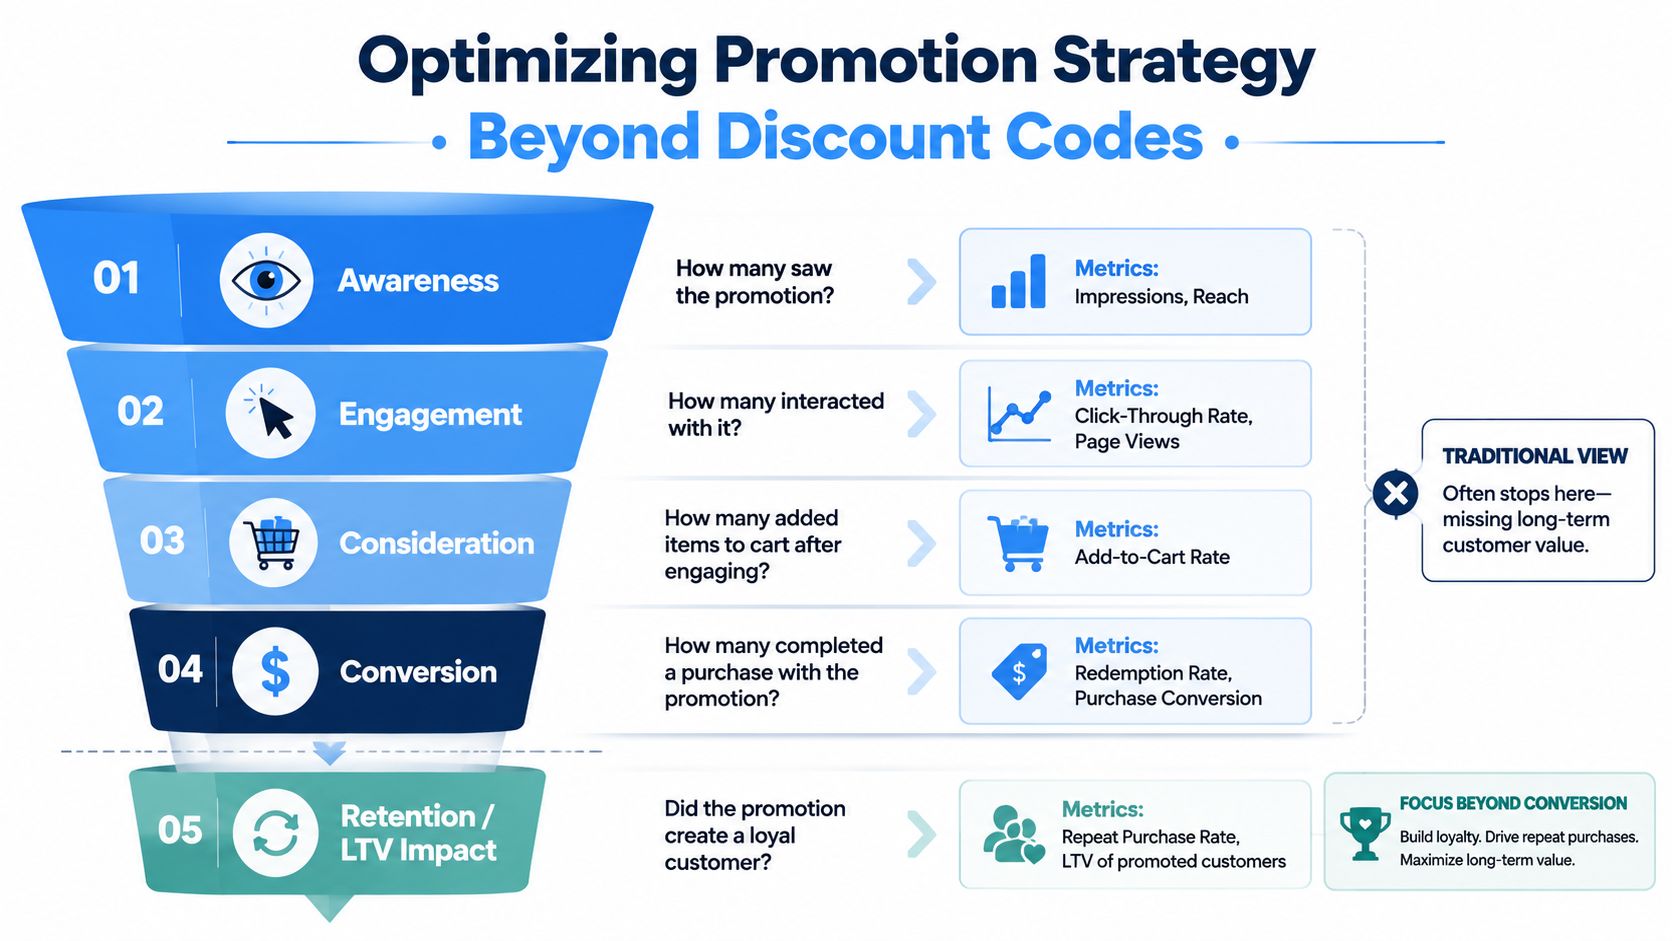
A promotion should be tracked across the full customer path, not just at checkout.
Use a funnel view that asks:
| Funnel stage | Question to answer | Why it matters |
|---|---|---|
| Awareness | Who actually saw the offer | Prevents over-crediting the campaign |
| Engagement | Who interacted with it | Separates passive exposure from active interest |
| Consideration | Who added to cart after exposure | Shows whether the promotion changed shopping behavior |
| Conversion | Who completed purchase | Tells you transaction outcome, not full value |
| Retention impact | What promoted cohorts do later | Reveals whether you bought loyalty or rented demand |
This is especially important if your traffic mix includes paid acquisition. Teams investing in Meta, Google, and other channels should understand how ad spend quality shapes promotional performance. If you need a primer for less technical stakeholders, this overview to learn about digital ads from NiKa is a useful starting point.
Segment by behavior, not by coupon alone
The segment that clicks but doesn’t buy is not the same as the segment that buys immediately. The repeat customer who purchases at full price is not the same as the shopper who only converts during sitewide sales.
A practical segmentation model usually includes:
- Full-price buyers: Protect these customers from unnecessary discounts
- Deal-sensitive shoppers: Test narrower incentives and exposure rules
- High-intent non-buyers: Look for friction, trust issues, or timing problems
- Repeat customers: Measure whether promotions increase order value or just lower net revenue
If you don’t separate deal-seekers from full-price buyers, your promotion strategy will drift toward the lowest-quality demand in your file.
Use promotion analytics to diagnose, not just report
The best teams review promotions like operators, not advertisers.
They ask:
- Did this offer improve conversion without depressing order quality?
- Did it acquire customers we want to keep?
- Did it lift behavior at a specific funnel stage, or just reduce checkout price?
- Would we run this again if we had to judge it on margin, not revenue?
That review gets stronger when the team keeps a clean testing log. Offer type, audience, timing, exposure rules, cart behavior, and post-purchase outcomes all belong in the same analysis. Quikly’s article on promotional ROI is a useful reference point for building that kind of post-campaign discipline.
The common assumption is that more promotion solves weak conversion. Often it just hides why conversion is weak in the first place.
Driving Conversions with Behavior-Driven Analytics
Generic promotions create weak signals. A sitewide discount tells you people like paying less. That isn’t an insight.
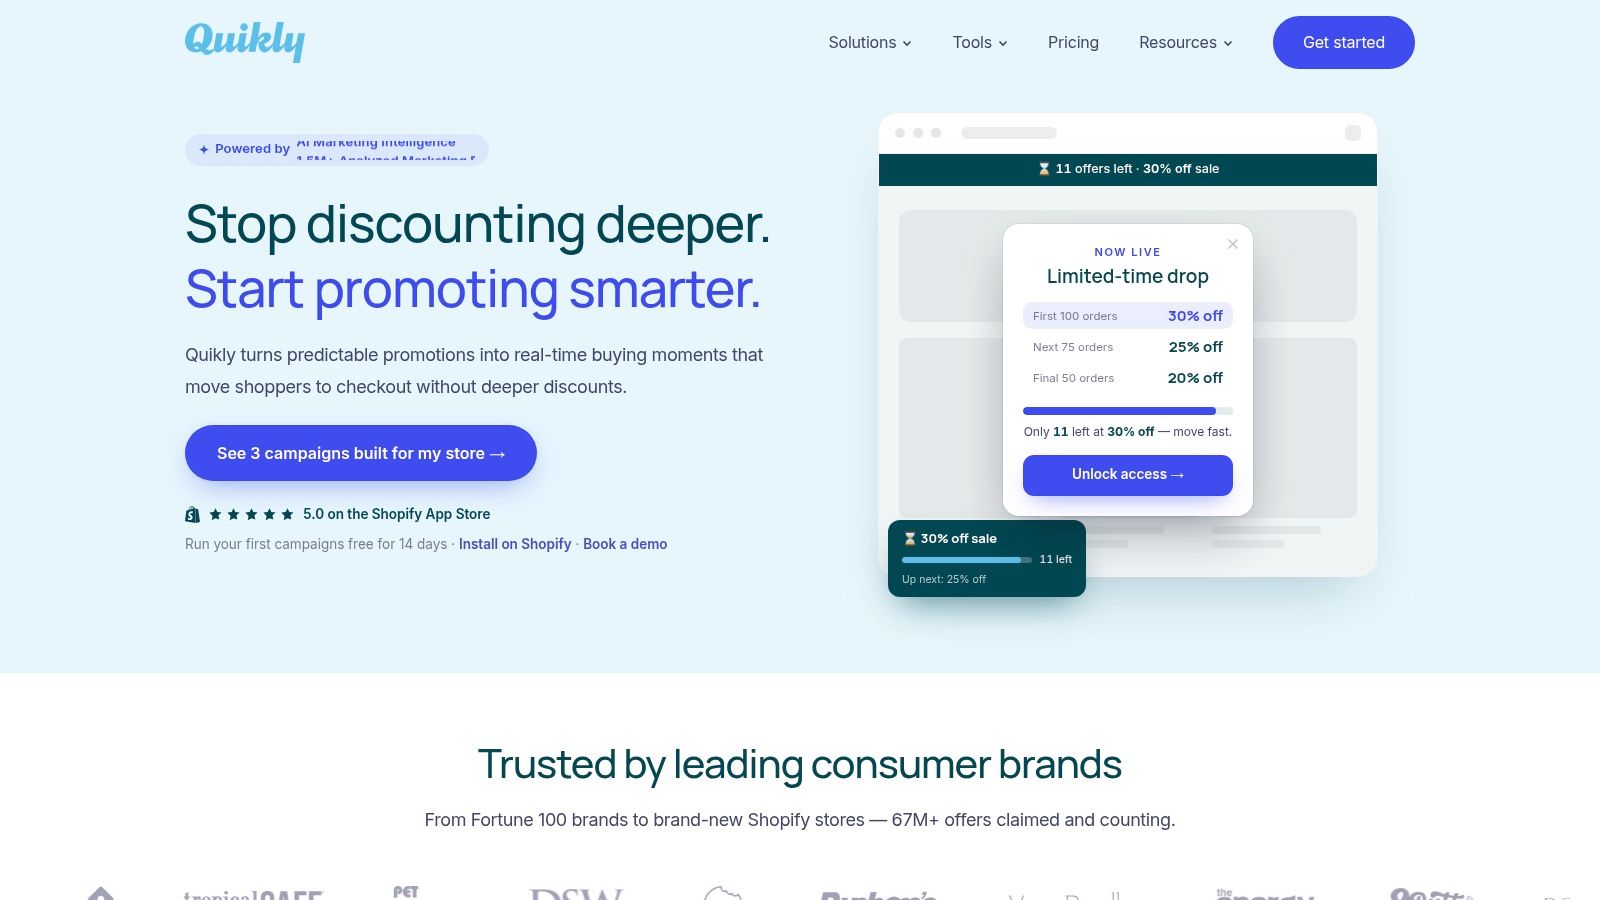
Behavior-driven promotion design produces much better data because the customer has to do something. They engage, respond to a condition, react to scarcity, or make a faster decision in a measurable context. That creates clearer analytical signals about intent.
Why behavior creates cleaner measurement
When a promotion is based on an action, the relationship between trigger and outcome becomes easier to observe. You can see who engaged, what they did next, and whether the experience changed purchase behavior.
That’s more useful than blanket discounting because it helps separate shoppers with real buying momentum from shoppers who respond to any lower price. On Shopify, that difference shows up in add-to-cart movement, order composition, and whether the campaign lifts action without broadening discounts across the entire audience.
The psychology matters
Some promotional mechanics work because they align with how people make decisions. Scarcity is one of the clearest examples.
Real-time low stock notifications such as “Only 3 left” can accelerate purchase decisions by activating loss aversion, where the fear of missing out outweighs the appeal of waiting. That creates urgency without relying on deeper discounts and can move passive browsers into action more efficiently than generic promotional pressure (Knutton on ecommerce conversion rates).
That distinction matters. Real scarcity is different from fake urgency. One reflects an actual constraint. The other trains skepticism.
What behavior-driven analytics e commerce looks like in practice
A useful setup tracks the chain between the mechanic and the outcome:
- Exposure to the trigger: For example, a low-stock notice or earned reward state
- Immediate engagement: Clicks, cart additions, variant selection, or checkout starts
- Commercial outcome: Purchase completion, order value quality, and later repeat behavior
This approach also improves analysis quality because the signal is narrower. Instead of asking whether a broad sale “worked,” you’re asking whether a specific trigger changed a specific behavior for a defined customer group.
For teams building a more mature measurement model, Quikly’s piece on customer behavior analysis is a strong companion to this way of thinking.
Promotions are easier to optimize when they are designed to create observable behavior, not just passive exposure.
What usually doesn’t work
The weaker path is familiar. Blanket popups. Sitewide discounts. Countdown pressure with no connection to actual inventory, customer intent, or order quality.
Those tactics can still create short bursts of activity. They just don’t create reliable learning. And when every campaign looks the same, the data gets flatter, the offers get more expensive, and the brand gets easier to ignore.
Better analytics starts with better promotional design.
A Practical Workflow for Continuous Improvement
Most Shopify teams don’t need more dashboards. They need a repeatable operating rhythm.
That rhythm matters because average e-commerce conversion rates still sit around 2.5% to 3.0%, while cart abandonment often exceeds 70%, which makes continuous funnel review essential if you want to improve baseline performance and make paid traffic work harder (Stape on e-commerce performance analytics).
A weekly or monthly review loop
Use a simple cycle your team can maintain.
-
Review the core numbers
Pull conversion rate, AOV, checkout completion, discount usage, and customer mix from Shopify and your analytics stack. Don’t stop at blended store averages if a campaign or channel shifted behavior. -
Find one real point of friction
Pick a problem with commercial weight. Maybe mobile product pages are producing cart adds without checkout starts. Maybe a promotion improved conversion but hurt order quality. -
Write a hypothesis
Keep it specific. “We think shoppers need a stronger reason to act now” is better than “we should test urgency.” “We think this offer is over-discounting repeat buyers” is better than “promo underperformed.” -
Run a controlled test
On Shopify, that might mean changing offer exposure, adjusting the reward structure, narrowing audience eligibility, or testing a different merchandising pairing. If you’re on Shopify Plus, coordinate with any custom checkout or audience logic already in place. -
Judge the result on economics
Look at conversion, yes. But also check AOV, customer type, and what happened after purchase. A test that improves orders while weakening margin quality isn’t a win.
What this process prevents
Without a workflow, teams drift into reactive promotion planning. They run the same offer again because it looked strong in gross revenue. They copy last quarter’s cadence because nobody documented the downside. They let acquisition teams optimize for traffic while retention and merchandising deal with the fallout.
A tighter process fixes that.
- It forces focus: One hypothesis is easier to learn from than five simultaneous changes.
- It protects margin: Every test has to earn its place economically.
- It improves team alignment: Paid media, CRM, merchandising, and ecommerce operations are looking at the same behavior chain.
Small tests beat big assumptions. Especially when promotions are involved.
Over time, this is what strong analytics e commerce becomes. Not a reporting function. A decision system that keeps your store from solving every problem with another discount.
If your Shopify team wants a smarter promotional model, Quikly helps you move beyond blanket discounts and toward psychology-backed experiences that increase purchase conversions without sacrificing margins or brand perception. It’s built for brands that want promotions to create momentum, not just markdowns.
Topics: analytics e commerce, shopify analytics, ecommerce metrics, promotion optimization, ecommerce strategy