A Shopify apparel brand can watch its conversion rate improve and still feel poorer at the end of the month. The dashboard says the site moved from 1.8% to 2.4%, but the lift came alongside sitewide 20% off codes, lower free-shipping thresholds, and weekly bundle offers. Gross margin per order fell, returns became harder to absorb, and customers started waiting for the next promotion instead of buying at full intent.
That pattern is common in practice. Acquisition gets the attention because it fills the funnel, while conversion rate optimization in digital marketing gets reduced to changing buttons, adding a timer, or offering a deeper discount. A stronger CRO program asks a harder question: did the change create profitable demand, or did it purchase a conversion?
The Quiet Margin Problem Hiding Inside Your Conversion Numbers
A rising conversion rate is useful, but it isn’t automatically healthy. The apparel brand in this scenario may have more completed orders while earning less contribution from each one. Once promotion cost, shipping subsidies, returns, payment fees, and acquisition spend enter the calculation, the headline conversion rate can hide a deteriorating business model.
Many Shopify teams get trapped. A campaign wins because more visitors purchase, then the team repeats it. The next campaign needs a stronger incentive to produce the same urgency. Customers learn the pattern quickly, and the brand gradually turns its calendar into a sequence of markdowns.
Practical rule: Never approve a CRO winner on conversion rate alone. Read the result against revenue per visitor, contribution margin, average order value, return behavior, and repeat purchase quality.
Discounts can still have a place. A controlled offer may clear seasonal inventory, reward a meaningful segment, or move demand into a period that would otherwise be weak. The problem is blanket discounting as the default conversion mechanism. It improves the visible outcome while weakening price confidence and teaching shoppers that waiting is rational.
What the conversion dashboard misses
A blended rate combines high-intent returning customers with cold paid traffic, mobile visitors with desktop shoppers, and full-price purchases with heavily discounted orders. It can also hide a technical failure that affects one device or payment method while the overall number remains stable.
For Shopify operators, the margin question should sit beside every test:
- Did the variant increase profitable orders?
- Did it bring demand forward, or only shift purchases from a later sale?
- Did it raise or lower average order value?
- Did the experience strengthen trust, or make the brand look permanently promotional?
Teams dealing with this tension can use alternatives to discounting for Shopify as a practical reference point. The central shift is simple: treat CRO as a margin-and-brand discipline, not a conversion-volume arms race.
What Conversion Rate Optimization Actually Means in Digital Marketing
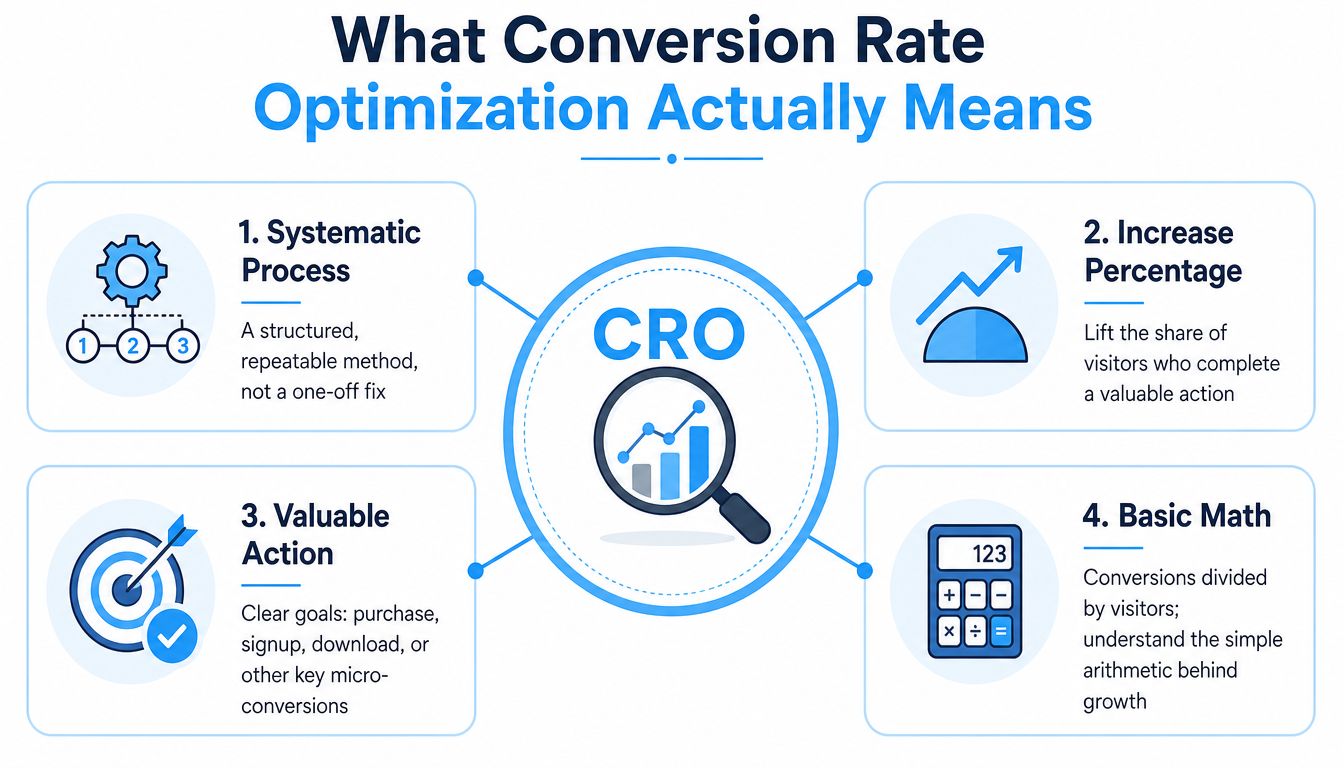
Conversion rate optimization, or CRO, is the systematic process of increasing the share of visitors who complete a valuable action. In ecommerce, that action may be a purchase, but the program can also measure add-to-cart, email signup, account creation, or another step that signals commercial intent.
The basic formula is:
Conversion rate = conversions ÷ visitors × 100
That arithmetic became a formal marketing operating metric during the 2000s, when teams began comparing channels and pages at scale using a common definition. The important refinement for Shopify brands is to pair the rate with the value of each action. A test that increases low-margin purchases may be weaker than a test that produces fewer, more profitable orders.
A foundational benchmark places average website conversion across industries at about 2% to 3%, while top-performing sites can reach 10% to 11% or higher, according to industry CRO benchmark summaries. Ecommerce performance often clusters around 2.5% to 3.0% globally, with meaningful variation by device and category, so landing pages, product pages, checkout flow, and offer design need separate diagnosis rather than one universal target.
CRO isn’t the same as acquisition or A/B testing
Traffic acquisition grows the denominator. SEO, paid social, paid search, affiliates, and email bring more people to the store. CRO improves what happens after those visitors arrive, so the acquisition investment has a better chance of producing a profitable action.
A/B testing is one method inside CRO, not the strategy itself. The strategy includes:
- Landing-page relevance, matching the promise of the ad, search query, or email.
- Product-detail clarity, including fit, ingredients, materials, delivery expectations, and proof.
- Cart and checkout usability, from shipping visibility to payment completion.
- Post-purchase flows, where the next purchase can be earned through relevance rather than another first-order discount.
- Retention loops, including returning-customer recognition and cross-device journeys.
For a concise explanation of the discipline and its operating principles, the Silva Marketing 2026 CRO overview is a useful supporting resource. Shopify teams can also use what conversion rate means to keep internal reporting consistent.
The KPIs and Diagnostic Lens That Reveal Where to Focus
The storewide conversion rate tells you what happened. It rarely tells you why. A Shopify team needs a stage-by-stage view that separates weak intent from preventable friction.
Start with the commercial funnel. Track add-to-cart rate, checkout starts, checkout completion, cart abandonment, and revenue per visitor. Break each view down by traffic source, device, new versus returning customer, product category, and promotion exposure. A blended average can make a margin leak look like a growth opportunity.
Read the funnel as a set of competing explanations
A low add-to-cart rate may indicate poor product relevance, weak merchandising, unclear value, or price resistance. A strong add-to-cart rate followed by weak checkout completion points to different problems, such as shipping surprises, payment failure, account requirements, or form friction.
Behavioral signals add the missing context. Time to first interaction can reveal whether the page loads but fails to communicate. Scroll depth shows whether shoppers reach sizing, reviews, delivery details, or the purchase module. Form-field drop-off identifies a specific obstacle, while payment failure rates can expose an issue that copy testing won’t solve.
| Funnel Stage | Primary KPI | Diagnostic Signal | Likely Friction Type |
|---|---|---|---|
| Landing page | Engaged visits and first interaction | Time to first interaction, early exits | Relevance or performance |
| Product detail page | Add-to-cart rate | Scroll depth, review interaction, size-guide use | Clarity, trust, or fit uncertainty |
| Cart | Checkout-start rate | Shipping interaction, coupon use, cart edits | Price surprise or offer confusion |
| Checkout | Checkout completion rate | Form-field drop-off, payment failures | Technical or usability friction |
| Post-purchase | Repeat-purchase conversion | Returning sessions, product-category progression | Weak retention or poor relevance |
Use cohorts instead of comfort metrics
A desktop conversion rate can conceal a mobile experience that fails during payment. A returning-customer segment may carry the entire result while first-time shoppers leave because the product page doesn’t answer basic trust questions.
The same logic applies to promotion analysis. Compare full-price and offer-exposed cohorts, then inspect revenue per visitor and margin contribution. The ecommerce performance metrics guide provides a useful vocabulary for building that dashboard, but the operating decision remains yours: fix the largest profitable gap, not the most flattering number.
A Step-by-Step Workflow for Diagnosing and Fixing Conversion
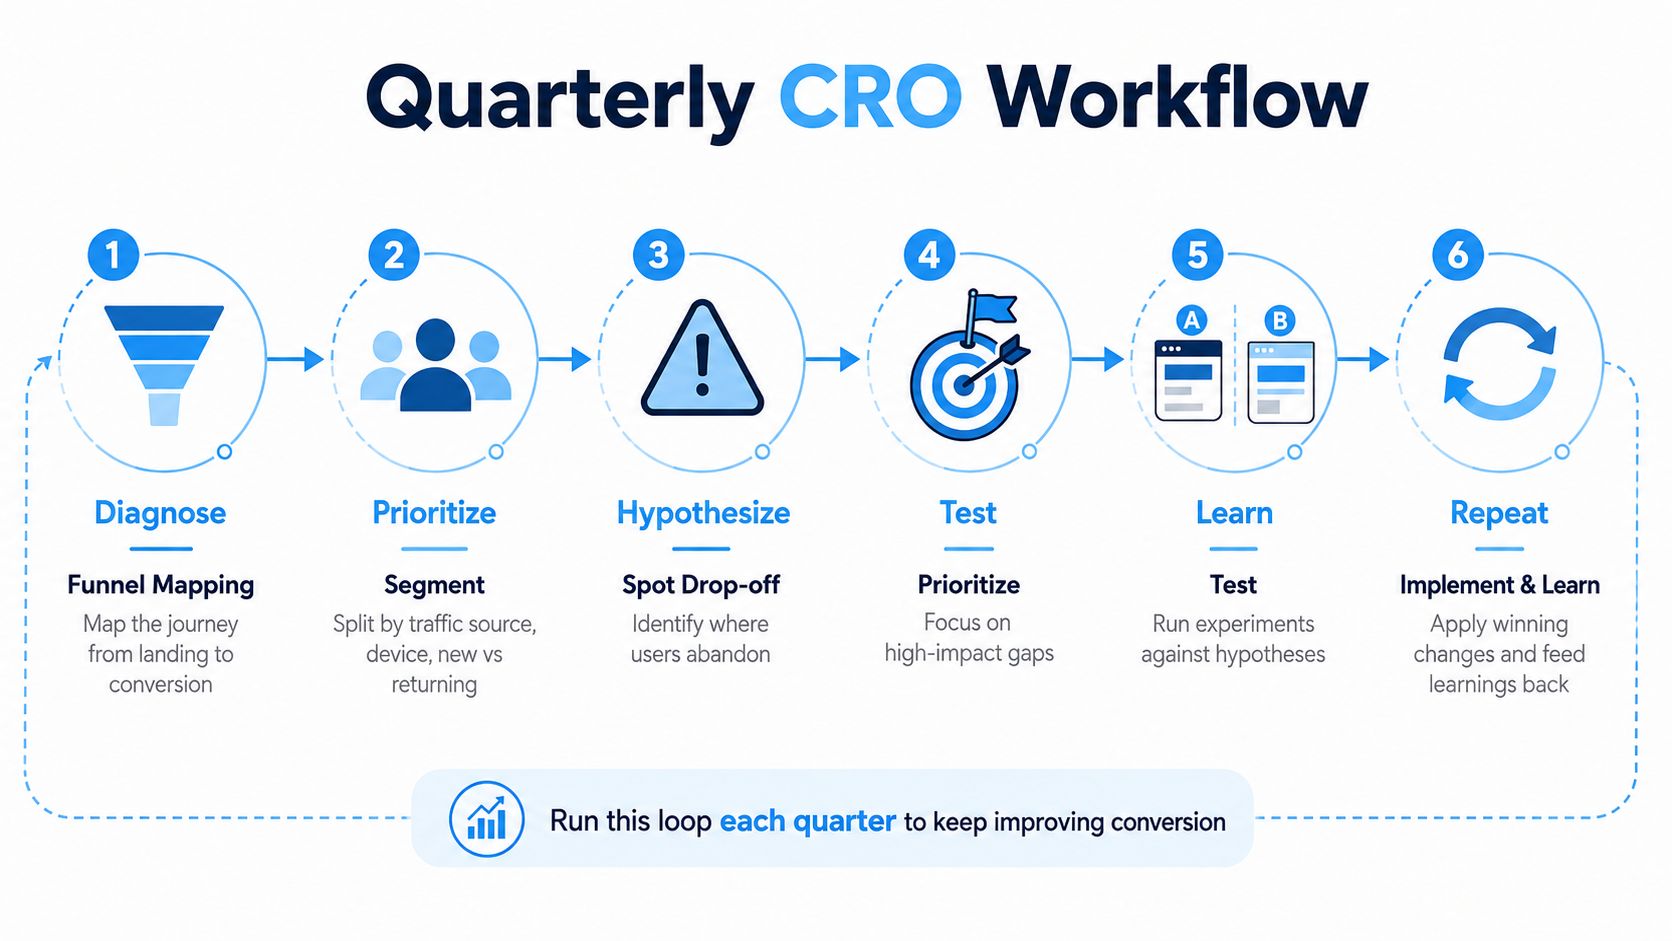
A workable CRO program doesn’t begin with a backlog of button colors. It begins with a repeatable diagnostic loop that a Shopify team can run each quarter.
Start with the journey, then find the leak
First, map the funnel. Identify the main landing paths, product detail interactions, cart transitions, checkout steps, and post-purchase actions. Segment the map by source, device, and new versus returning visitors before drawing conclusions.
Second, add qualitative evidence. Watch session replays, run short on-page surveys, and mine support tickets, live chat, email replies, and returns feedback. Label each drop-off as friction, confusion, or disinterest. Those categories prevent a team from treating every problem as a copy problem.
Third, write a narrow hypothesis. Use a consistent format:
For [audience], changing [specific experience] should improve [primary metric] because [observed reason].
A useful hypothesis names the audience, the change, the expected direction of impact, and the metric that decides the test. “Improve the product page” isn’t testable. “For mobile visitors arriving from product-specific paid ads, place delivery and returns reassurance beside the purchase action because recordings show repeated scrolling before abandonment” is.
Prioritize for commercial impact
An ICE-style matrix can rank ideas by expected impact, confidence, and implementation effort. Add two Shopify-specific weights: traffic volume and margin impact. A test on a high-traffic collection with healthy contribution margin may deserve priority over a clever improvement on a low-volume page.
Fourth, define the experiment before launch. Set the primary KPI, supporting metrics, audience rules, runtime guardrails, and sample requirements. Decide what would invalidate the readout, such as a tracking break, payment outage, or major campaign mix shift.
Fifth, sequence tests so learning compounds. Don’t run overlapping changes on the same checkout element and then argue over attribution. Start with a structural friction test, apply the learning, and use the next experiment to refine the remaining uncertainty.
Sixth, read out the result. Separate a durable improvement from novelty, audience mix, or promotion timing. Record the decision in a living playbook: what changed, who responded, what happened to margin, and what the result suggests testing next.
Behavioral Promotion Tactics That Lift Conversion Without Eroding Margin
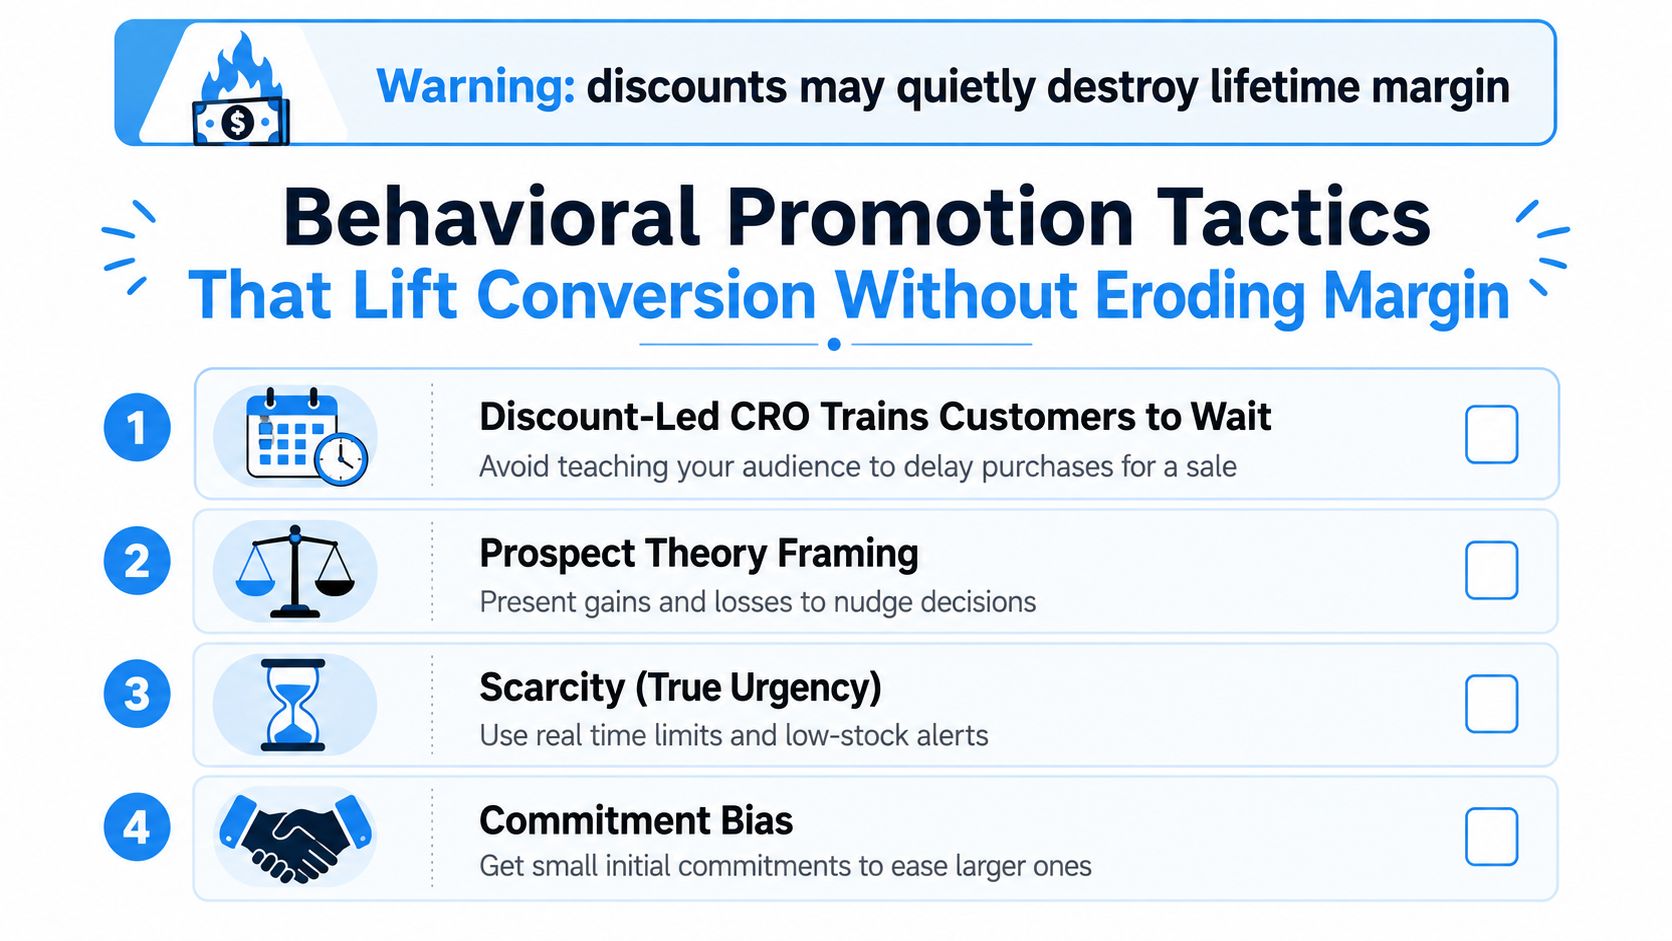
Discount-led CRO feels measurable because the incentive is obvious. It also creates a dangerous habit. If every conversion problem receives a larger discount, shoppers learn to delay, the brand loses pricing power, and the team confuses transferred margin with new demand.
Behavioral tactics can create a reason to act without making the permanent price lower. The principle isn’t pressure for its own sake. It is to align the offer with a real decision context and make the cost of waiting understandable.
Use urgency that reflects reality
Scarcity can shorten deliberation because it gives shoppers information about availability and timing. A controlled experiment involving 480 participants found that scarcity messages such as “Only 2 items left!” and “Offer ends in 5 minutes!” increased impulse buying, perceived product value, and purchase intention, with effects moderated by trust, anxiety, and product involvement, as reported in the Canadian Journal of Marketing Research experiment.
Use that principle carefully:
- Inventory urgency: Show low-stock messaging only when the inventory state supports it.
- Shipping urgency: Use a cutoff that reflects the shopper’s region and actual dispatch schedule.
- Event urgency: Close an offer when the event ends, rather than leaving a timer running indefinitely.
- Production urgency: Explain made-to-order lead times or edition limits when they constrain supply.
A scoping review indexed by PMC connects scarcity messages with shorter deliberation, higher purchase amounts, stronger product evaluations, and greater satisfaction with scarce products, as described in the peer-reviewed review of scarcity messaging. False stock counts do the opposite of the intended job. They damage trust at the moment the shopper is deciding whether to believe the brand.
Protect margin with framing and relevance
Prospect theory framing helps shoppers evaluate gains and losses relative to a reference point. Clear comparison against MSRP, a visible benefit of completing a bundle, or a transparent shipping threshold can make value easier to understand without cutting every item.
Commitment and consistency can support a staged journey. A product quiz, saved preference, waitlist, or email reminder gives the shopper a small, relevant commitment before the purchase decision. The follow-up should reflect what they selected, not dump a generic code into their inbox.
Personalization can preserve value by making the offer more relevant. Returning-customer recognition, replenishment prompts, complementary product suggestions, and pay-later messaging for high-AOV items can remove uncertainty without reducing the product price.
A 2023 meta-analysis found that purchase likelihood was strongest for scarcity based on excessive demand rather than restricted supply, and that the strongest effects varied by product type. It also found urgency-based scarcity wasn’t the strongest form in pooled results, so a five-minute timer isn’t automatically the right answer. Read the product scarcity meta-analysis before turning every promotion into a countdown.
Before launching, ask whether the promotion:
- Shifts demand forward, instead of subsidizing a purchase that would have happened later.
- Pulls demand from a competitor, rather than from your own future sale.
- Creates useful participation, rather than another overlay shoppers dismiss.
- Preserves trust, because the limit is real and explainable.
- Protects contribution margin, after shipping, returns, fees, and fulfillment.
The Shopify CRO Tool Stack and How the Pieces Fit Together
Tools should support the workflow, not substitute for one. Shopify merchants usually need four connected layers: measurement, behavioral diagnosis, experimentation, and activation.
The analytics layer combines Shopify Analytics for store and order reporting with GA4 for acquisition paths and event analysis. Hotjar or Microsoft Clarity can show recordings, heatmaps, and interaction patterns. The gap appears when teams look at only one layer. Shopify may show the order outcome, GA4 may show the source, and a replay may reveal the payment or navigation issue.
The experimentation layer ranges from lightweight theme or Shopify-native testing options to dedicated platforms such as Convert or VWO. The decision isn’t about feature count. A smaller Shopify plan may be enough when traffic, test velocity, and implementation complexity are modest. A dedicated platform earns its place when the team has clean tracking, a steady hypothesis pipeline, engineering support, and enough traffic to make controlled experimentation practical.
The personalization layer includes recommendation tools such as Rebuy, Nosto, and LimeSpot, alongside Klaviyo and Attentive for email and SMS lifecycle work. The important connection is the data handoff. A product viewed on site should inform a relevant message, and a post-purchase sequence should avoid recommending something the customer already bought.
The promotion layer can include Refersion for affiliate activity, Bold Commerce for bundles, Shop Pay Installments for payment flexibility, and Quikly for behavior-driven urgency and scarcity campaigns. These tools solve different problems and shouldn’t be judged by the same KPI.
| Layer | Primary Tools | Best For |
|---|---|---|
| Analytics | Shopify Analytics, GA4 | Revenue, traffic, funnel, and cohort reporting |
| Behavioral diagnosis | Hotjar, Microsoft Clarity | Replays, heatmaps, hesitation, and friction discovery |
| Experimentation | Shopify testing options, Convert, VWO | Controlled validation of page and journey hypotheses |
| Personalization and lifecycle | Rebuy, Nosto, LimeSpot, Klaviyo, Attentive | Relevant recommendations, email, SMS, and retention |
| Promotion and merchandising | Refersion, Bold Commerce, Shop Pay Installments, Quikly | Affiliate, bundles, payment flexibility, and structured urgency |
For a Shopify brand at meaningful scale, the stack should remain operationally simple. Spend on additional tooling only after the diagnostic and readout workflow is already running. A platform attached to weak event tracking and unprioritized ideas creates more dashboards, not better decisions.
Mini Case Studies From Shopify Merchants Putting It Together
CRO becomes clearer when the team starts with an observed problem rather than a favorite tactic. The following examples are anonymized operating scenarios, not attributed performance claims.
Apparel brand with a trust gap
A mid-market apparel store saw strong product-page engagement but a weak transition from cart to completed checkout. Recordings and support messages pointed to uncertainty around fit, delivery timing, and returns.
The team tested clearer fit guidance, delivery expectations, and returns reassurance near the purchase decision. The primary metric was checkout completion, with margin per order and return behavior as guardrails. The important trade-off was avoiding a sitewide incentive. The brand invested in clarity instead of paying every shopper to overlook uncertainty.
DTC skincare merchant focused on the second order
A skincare merchant had a reasonable first-purchase flow but wasn’t turning product education into a repeat routine. The trigger insight came from post-purchase behavior, where customers engaged with usage guidance but received generic follow-up messaging.
The team sequenced replenishment education and complementary product recommendations around the customer’s first purchase. It evaluated repeat-purchase conversion rather than forcing an additional first-order discount. The margin question was whether the recommended product increased basket relevance or added a costly incentive to a customer who already intended to return.
Home goods store using returning-customer context
A home goods store found that returning visitors often revisited categories they had already browsed, while the standard recommendation module showed the same popular products to everyone. The test used returning-customer cohorts to adjust recommendations based on prior category interaction.
The primary metric was revenue per visitor, paired with margin per visitor and product mix. The team accepted that a lower-priced recommendation could sometimes be more relevant, but it rejected recommendations that merely increased units while lowering contribution quality.
| Merchant Type | Trigger Insight | Lever Used | Primary Metric Moved | Margin Consideration |
|---|---|---|---|---|
| Apparel | Fit and delivery uncertainty before checkout | PDP trust and clarity changes | Checkout completion | Avoided blanket discounting and monitored returns |
| DTC skincare | Education engagement after first purchase | Post-purchase sequencing | Repeat-purchase conversion | Protected second-order contribution |
| Home goods | Generic recommendations for returning visitors | Cohort-based personalization | Revenue per visitor | Reviewed margin per visitor and product mix |
These examples share a pattern: the headline metric followed the customer problem. The team didn’t start by asking which promotion could force a decision. It asked what prevented a useful decision from happening.
Tying Conversion Back to Margin and Brand Health
Healthy CRO gives the business more than completed orders. It improves the connection between intent and action while protecting contribution margin, perceived value, and repeat behavior.
A practical quarterly loop looks like this:
- Diagnose the funnel by source, device, customer status, and product context.
- Choose one high-impact gap and identify whether it reflects friction, confusion, or disinterest.
- Test a behavioral or experience hypothesis with a primary KPI and margin guardrails.
- Read out the result against conversion, AOV, revenue per visitor, contribution margin, repeat-purchase rate, and trust signals.
Set explicit limits before testing. A margin floor per order prevents a conversion win from becoming a profitability loss. Promotion frequency caps stop the calendar from training customers to wait. Brand-trust checks catch fake scarcity, unclear expiry rules, and offer language that makes a premium product feel permanently marked down.
A healthy result doesn’t require every metric to rise together. A test may produce a modest conversion change but a stronger margin per visitor. Another may improve AOV while lowering checkout completion. The senior decision is to judge the portfolio, not celebrate whichever number moved most dramatically.
The operating standard: A CRO win helps the right customer act with more confidence, at an acceptable cost, without teaching the entire audience to wait for a cheaper price.
Choose one funnel stage where visitor intent and behavior are furthest apart. Use the diagnostic signals above to write one hypothesis, test it without a blanket discount, and read the result against margin as carefully as conversion. Quikly offers Shopify merchants on-brand urgency and scarcity experiences built around capped claims, time limits, or both, giving teams a way to structure action without reverting to repetitive sitewide markdowns. Visit Quikly to evaluate whether that approach fits your next CRO experiment.
Topics: conversion rate optimization, digital marketing, CRO strategy, Shopify CRO, ecommerce optimization