
A flash promotion ends, and your Shopify dashboard reports one revenue figure. Meta Ads Manager claims another. Google Ads takes credit for the branded search conversions, while Klaviyo attributes most orders to the email flow that went out near the deadline. Every platform has a plausible story, and none of them gives you a reliable answer about what happened.
That conflict becomes expensive when you use it to decide the next promotion, the next paid-media budget, or the next discount level. Shopify brands already face shrinking margins, insufficient conversion, and the risk of training customers to wait for sales. Multi-touch attribution can make the customer journey easier to read, but it won’t turn incomplete path data into proof of causation.
The Problem Every Shopify Brand Hits When Reports Disagree
The disagreement usually starts with a real customer journey. A shopper sees a Meta ad, ignores it, receives a promotional email, searches for the brand, visits from an organic result, and returns through a retargeting impression before buying. Shopify records the order and revenue. Each marketing platform sees only the events it can identify, and each applies its own reporting logic, lookback window, and attribution rules.
The result is predictable. Meta may count the impression or click, Google may claim the branded search, and Klaviyo may assign the sale to the email click. The founder then faces a tempting but flawed conclusion: increase the budget for whichever dashboard reports the highest return.
Practical rule: A platform report is an account of the platform’s observable interactions, not a neutral account of the entire customer journey.
Multi-touch attribution exists to close that gap. Rather than awarding all credit to the final identifiable interaction, it distributes fractional credit across multiple touchpoints that preceded the order. The IAB’s 2017 primer and later guidebook framing describe MTA as a way to assess the relative contribution of campaign impressions and measure incremental impact at a granular level to guide future spend.
Why the Shopify order still matters most
Shopify should remain the commercial anchor. Its order record tells you what was purchased, the order value, discount usage, refunds, and other details that advertising dashboards don’t own. It doesn’t explain every influence that led to the order, but it gives the business a consistent conversion and revenue reference.
That distinction matters during promotion planning. A campaign can receive generous platform credit while producing orders at a discount level that weakens contribution margin. Another campaign can appear modest in click-based reports while creating the awareness that makes later branded search and email conversion possible.
The useful question isn’t which dashboard wins. It’s which touchpoints appeared in the path, which ones survived measurement, and whether the associated promotion created incremental, profitable demand. MTA can help with the first two questions. It can’t answer the last one by itself.
What Multi-Touch Attribution Actually Is
Multi-touch attribution assigns fractional conversion credit across multiple marketing interactions in a customer’s path to purchase. A last-click model gives the entire order to the final measurable click. MTA asks how the other observable touches may have contributed before that click.
Consider a five-touch Shopify journey:
- The shopper sees a Meta ad.
- They read a Klaviyo email.
- They click a Google branded search ad.
- They return through an organic blog visit.
- They buy after seeing a retargeting impression.
Last-click reporting may give all the credit to the final interaction, depending on the platform and tracking rules. A linear MTA model treats the observed path differently. It gives 20% to each touchpoint, because the standard linear attribution model comparison divides credit equally across five interactions.
The order’s revenue hasn’t increased. The reporting has changed. Instead of pretending that the final touch created the entire decision, the model recognizes the earlier ad, email, branded search, and content visit as part of the measurable sequence. For a non-analyst, that is the core mechanic: credit is split mechanically across the path.
What MTA can and can’t tell you
MTA is a path-level model. It ranks and credits interactions that preceded a conversion, which makes it useful for understanding journey shape, channel participation, and campaign sequencing. It can show that promotional email frequently appears late in a path, or that paid social often appears earlier, without forcing one channel to own the entire order.
It remains correlational rather than causal. Independent measurement analysis explains the central limitation: MTA observes which interactions came before a conversion, not which interactions incrementally caused it. Click-heavy, bottom-funnel channels can therefore receive too much credit, while view-through and upper-funnel influence can be undercounted.
For a broader explanation of the mechanics behind attribution frameworks, how attribution modeling works provides useful background. The operational takeaway is simple: use MTA to understand the visible route to purchase, then use incrementality testing to determine whether changing exposure changes outcomes.
Comparing the Common Attribution Models
No attribution model is universally correct. Each model encodes a belief about where value sits in the customer journey, so the right choice depends on the decision you’re trying to make.
| Model | Credit Shape | Best For | Main Weakness |
|---|---|---|---|
| Linear | Equal credit across every observed touch | A first read on channel mix and longer consideration paths | Treats every interaction as equally influential |
| Time-decay | Increasing weight toward touches closer to conversion | Short promotional windows and recent conversion influence | Can undervalue awareness and earlier education |
| Position-based | 40% to first touch, 40% to last touch, 20% split across middle touches | Brands balancing discovery and closing interactions | Assumes the first and last touches deserve the same priority |
| Algorithmic or data-driven | Credit shaped by observed contribution patterns | Complex journeys with sufficient conversion data | Can hide assumptions and produce false precision |
Linear attribution
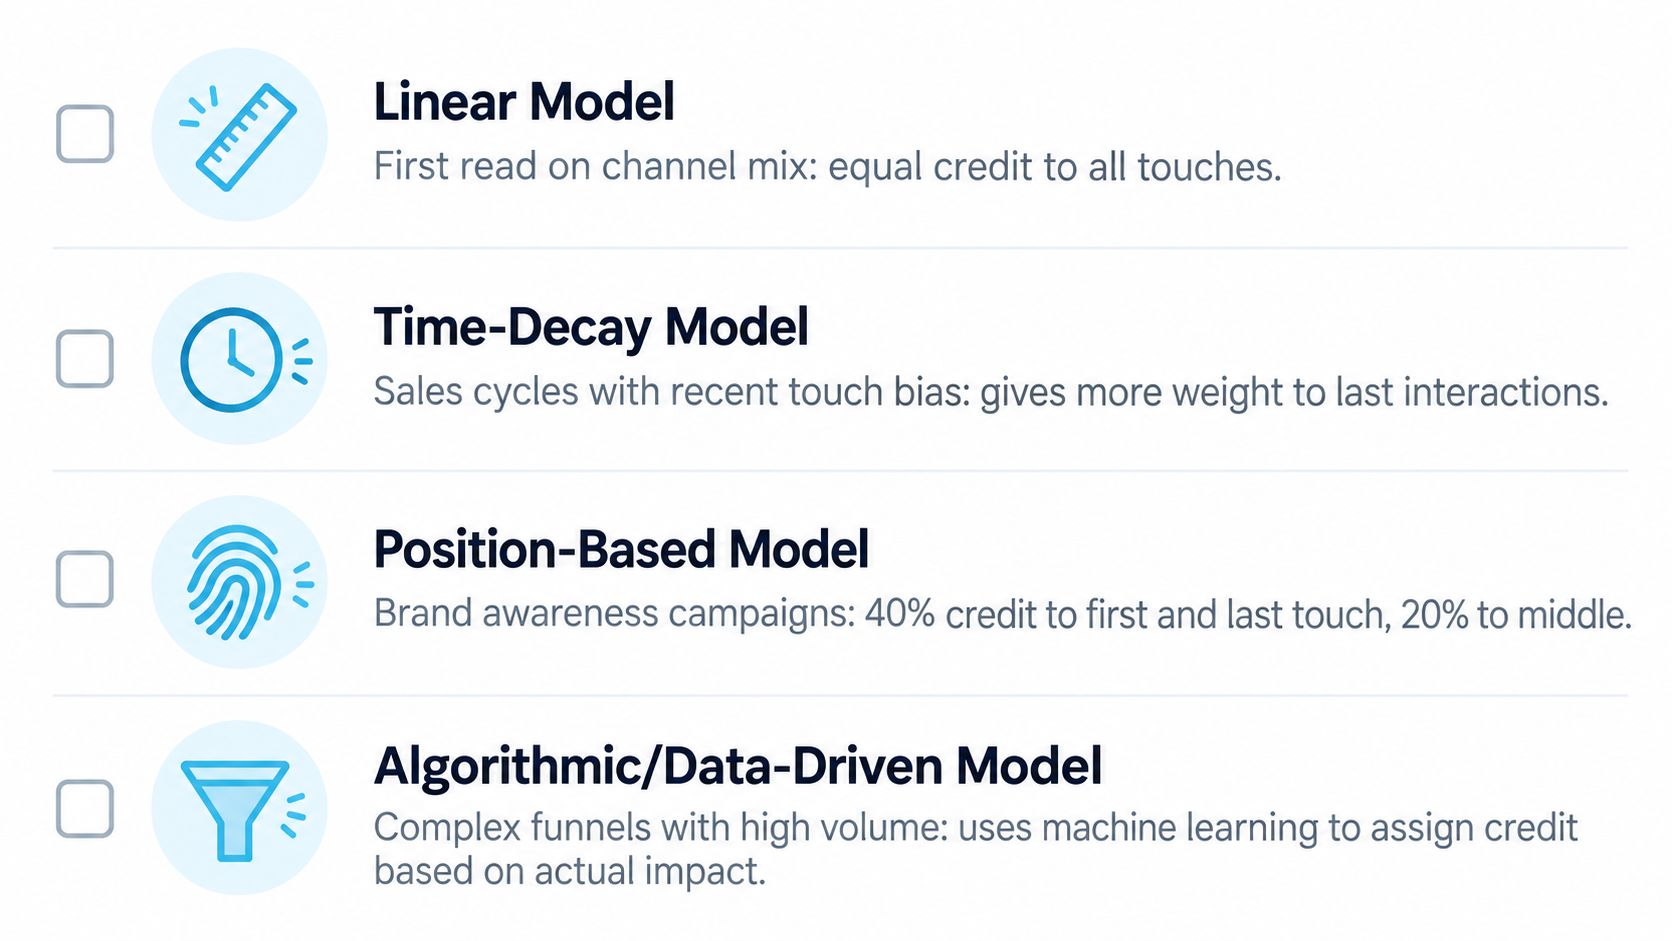
Linear attribution is the easiest model to explain. If a path contains five interactions, each receives 20% of the credit under the documented linear model rule. Its mental shape is a flat line. Nothing stands out, which is useful when you need a neutral starting point and don’t yet trust your assumptions.
Its weakness is equally clear. A five-second retargeting impression and a substantial product education session can receive identical treatment if both appear as touches. Linear attribution describes participation, not importance.
Time-decay attribution
Time-decay puts a slope into the path. Later touches receive more credit, while earlier touches receive less. That can fit a short flash promotion, where a shopper sees an offer, returns near its closing window, and converts after a reminder.
The trade-off is strategic. A time-decay model can make the final email or retargeting interaction look highly productive while reducing the apparent value of brand content, prospecting, and early social exposure. Use it when recency is part of the question, not as a permanent verdict on channel quality.
Position-based attribution
Position-based, or U-shaped, attribution anchors 40% to the first touch and 40% to the last touch, with the remaining 20% split across middle touchpoints, as described in this position-based attribution guide. Its shape has two peaks, one at discovery and one at conversion.
That structure suits a Shopify brand that wants to value both acquisition and closing. It can be especially readable for awareness campaigns paired with urgency messaging. Still, the percentages are a rule, not an observed law of buyer behavior.
Algorithmic and data-driven attribution
Algorithmic attribution uses statistical or machine-learning methods to infer contribution patterns from observed journeys. Shapley-style approaches may compare the presence and absence of touchpoints across paths, but the output remains dependent on data quality, identity resolution, model design, and the platform’s assumptions.
GA4’s data-driven attribution also has an activation threshold. One implementation guide states that it requires 400 conversions for the key event and 20,000 total conversions across all events within the lookback window before activation, with practitioners often testing 30-, 60-, and 90-day lookback windows. Those requirements and window choices can materially affect which stores can use the model meaningfully.
Where Multi-Touch Attribution Quietly Breaks Down
MTA looks precise because it can assign credit at the touchpoint level. The problem is that the path you see is the path that survived measurement.
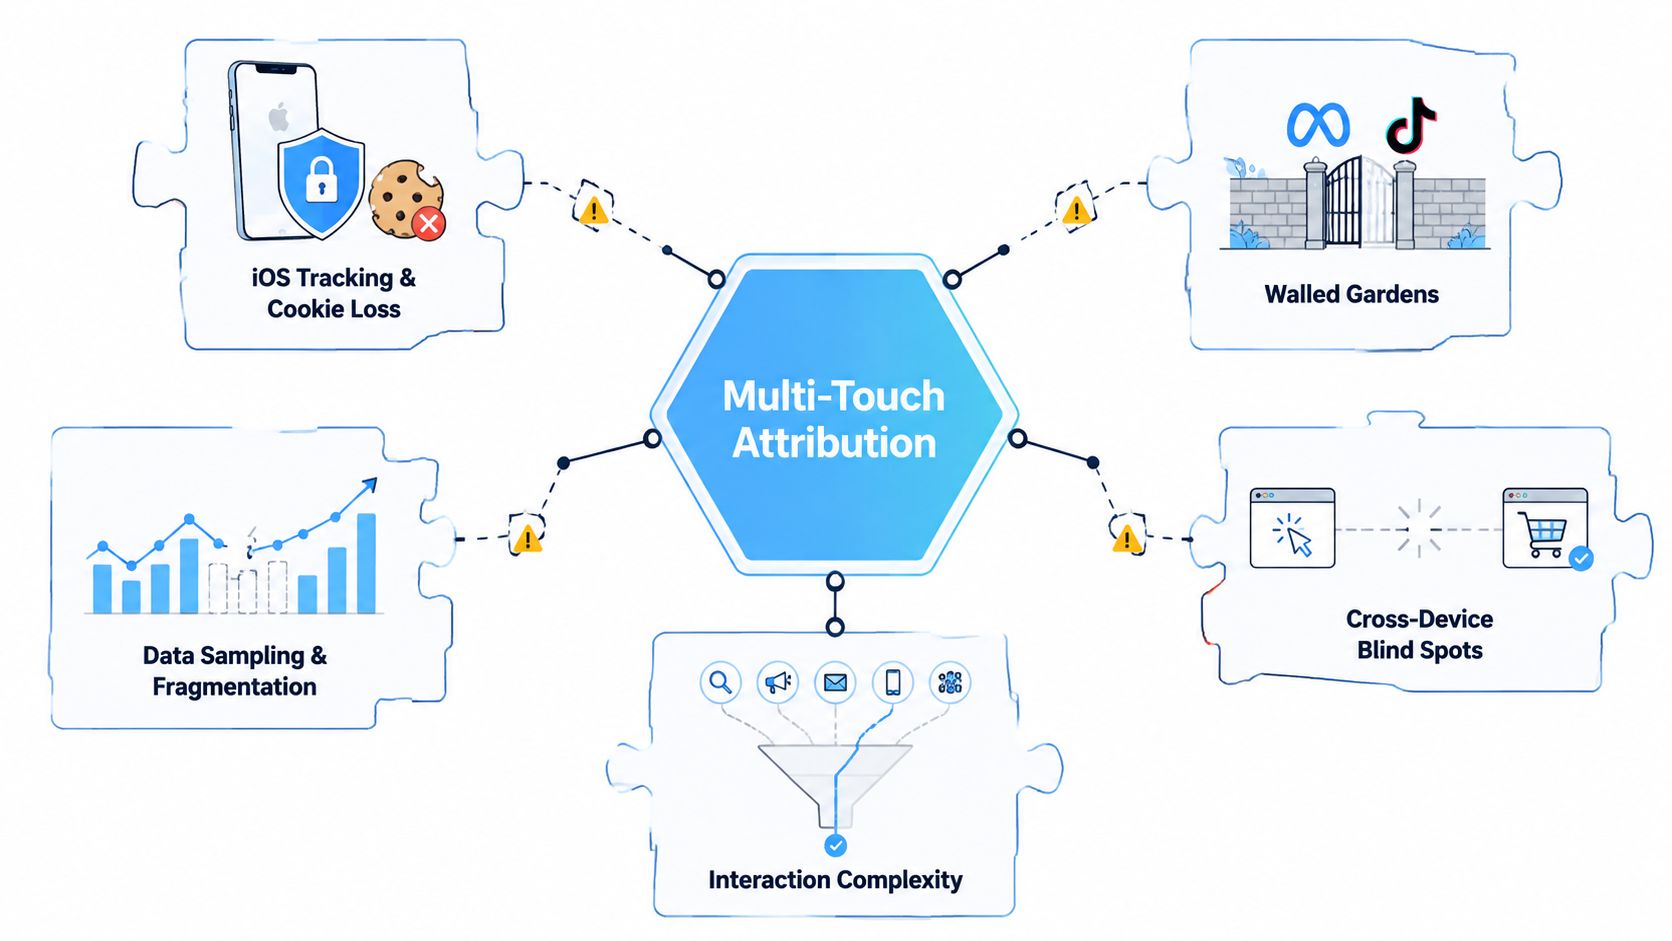
Privacy controls, ad blockers, consent restrictions, cookie loss, and cross-device behavior remove portions of many journeys. Independent attribution analysis describes MTA as increasingly incomplete, particularly when offline influence, word-of-mouth, AI-assisted research, and other non-click exposures sit outside the observable path.
Five blind spots Shopify teams should expect
- iOS tracking and cookie loss: Consent choices and platform privacy controls can remove ad exposure or conversion signals before they reach the model.
- Walled gardens: Meta and TikTok report through proprietary systems and don’t expose the full set of interactions that occur inside their environments.
- Offline influence: Retail visits, events, packaging, referrals, and conversations may influence an order without generating a trackable click.
- Dark social: Direct messages, Slack shares, private communities, and copied links often arrive without reliable UTM parameters.
- Identity stitching: Guest checkout, multiple devices, shared household accounts, and anonymous-to-known transitions can split one shopper into several records.
The practical consequence is redistribution. If an upper-funnel impression disappears, the tracked email click or branded search interaction can absorb more of the apparent credit. The measured channels look stronger, while the missing channels become harder to defend.
This doesn’t make MTA useless. It makes it directional. Treat it as a map of observed behavior, not a complete census of influence. Calibrate its conclusions against incrementality testing or marketing mix modeling before making major budget decisions.
Putting MTA to Work in a Shopify Stack
A useful Shopify attribution setup doesn’t require every tool to agree. It requires each source to perform a defined job and a clear rule for which system owns revenue.
Start with Shopify order data as the commercial source of truth. Use GA4 to understand journeys and channel sequences, Klaviyo and Postscript to capture owned-channel events, and ad-platform conversion data as a paid-media cross-check. The Shopify marketing automation tool overview is useful when auditing how those owned-channel systems fit into the broader stack.
Build the data path before choosing the model
Shopify’s pixel and Customer Events infrastructure can send first-party events, but implementation still needs discipline. Where consent permits, enrich events with stable first-party identifiers such as shopify_customer_id and a hashed email, then document when an identifier is unavailable. Don’t assume that a technically captured event represents a fully stitched customer journey.
UTM governance matters just as much. Standardize source, medium, campaign, content, and promotion naming across Meta, Google, email, SMS, affiliates, and creator links. A model can’t repair inconsistent campaign names or a checkout path that drops parameters.
| Source | What it feeds in | Common failure mode |
|---|---|---|
| Shopify orders | Revenue, products, discounts, refunds, customer status | Treating order data as a complete marketing journey |
| GA4 | Sessions, events, paths, channel context | Thresholding, consent gaps, and identity fragmentation |
| Klaviyo and Postscript | Email and SMS sends, clicks, conversions | Over-crediting owned messages near purchase |
| Meta and Google Ads | Paid exposure, clicks, reported conversions | Proprietary lookback logic and overlapping claims |
| Customer Events and server-side collection | First-party event signals | Weak event naming or incomplete consent handling |
Choosing an external MTA layer
Third-party options such as Triangular, Northbeam, Rockerbox, and Attribution can reduce the manual work of joining sources. Compare them on cost, time to value, identity resolution, data access, and Shopify order webhook handling, not just the model names shown in a sales deck.
A Shopify Plus team may justify a more involved implementation when paid spend, channel complexity, and offline activity make spreadsheets unmanageable. A smaller store may get more value from clean UTMs, reliable Shopify order exports, and a simple model than from a platform fed with incomplete inputs.
A usable first ninety days should produce three outcomes:
- Events have been audited against actual Shopify behavior.
- UTM naming is enforced across every outbound campaign.
- The business has chosen one revenue source of truth and documented how other reports reconcile to it.
Reading the Results Without Misleading Your Budget
The question isn’t “Which attribution model is right?” The better question is which model is appropriate for this decision.
Use linear attribution for an initial read on channel participation. Use time-decay when you’re evaluating a short conversion window and want recent touches to carry more weight. Use position-based attribution when both discovery and closing matter to your growth plan. Reserve algorithmic or data-driven models for situations where the data volume, identity quality, and assumptions are strong enough to justify the added complexity.
Before moving budget, run three checks.
- Check the high-intent contradiction: If branded search suddenly appears weak, ask whether the model is missing the earlier exposure that created the search.
- Check customer concentration: Remove the top decile of customers and see whether the conclusion still holds. A small number of unusually valuable paths can distort a channel decision.
- Check assisted behavior: If a channel is supposed to nurture demand, its assisted conversions should move in a direction consistent with that role. If they don’t, inspect tracking before cutting spend.
These checks don’t prove causality. They expose fragile conclusions.
A channel can lose MTA credit and still prime the sale. A promotional email can appear in many converting paths because it reaches shoppers who were already ready to buy. HarvestMyData’s sales ROI calculator can help frame the financial side, but revenue efficiency should still be evaluated alongside contribution margin, discount cost, refunds, and repeat purchase behavior.
For promotion-specific decisions, compare attribution with promotional ROI analysis. A campaign that earns path credit but requires increasingly deep discounts may be producing reported conversions without producing healthy economics.
Why Incrementality Testing Complements Multi-Touch Attribution
MTA answers one question: Which observable touches appeared before the conversion? Incrementality testing answers a harder question: What would have happened without the touch or campaign?
That distinction makes incrementality the causal layer MTA lacks. A geo holdout or matched-market test exposes one region or audience to a campaign while a statistically similar comparison group doesn’t receive it. The difference in outcomes estimates the campaign’s incremental effect rather than rewarding every interaction that happened to precede an order.
Promotion creates a special attribution trap
Urgency and scarcity campaigns can increase click frequency, return visits, and last-mile interactions. MTA may interpret that dense activity as strong contribution, even when many shoppers would have purchased without the promotion or would have bought at a different discount level.
A holdout helps separate path presence from changed behavior. For paid social, that may mean a geographic holdout. For email frequency, it may mean a matched-market split. For an owned promotion, it may mean holding back a defined audience while preserving comparable customer conditions.
| Dimension | Multi-Touch Attribution | Incrementality Testing |
|---|---|---|
| Core question | Which observed touches preceded conversion? | What changed because of the campaign? |
| Primary output | Fractional credit across a path | Estimated incremental outcome |
| Main strength | Maps journey shape and channel participation | Tests causal lift |
| Main weakness | Sensitive to missing and biased tracking | Requires test design and a valid comparison group |
| Budget role | Diagnostic input | Stronger evidence for allocation decisions |
Incrementality testing guidance is relevant here because the methods work better together than as substitutes. MTA shows where scarcity messaging sits in the journey. Testing shows whether that messaging changed purchase behavior.
One is a map. The other is a compass. A map helps you understand the route, but it can’t tell you whether taking that route caused the destination to appear.
A Practical Recommendation for Brands Running Urgency Promotions
For a Shopify brand using urgency or scarcity, treat MTA as a journey diagnostic, not a budget authority. Start with position-based or data-driven reporting to understand where the promotion appears in the path, then validate important decisions with an incrementality test, such as a paid-social geo holdout, an email-frequency matched-market split, or a promoted-list holdout in Klaviyo.
Read those results beside margin. A promotion that receives substantial attribution credit but depends on repeated discounting isn’t a winner if contribution margin deteriorates or customers learn to wait for the next offer. Discount depth should follow incremental lift and profitable behavior, not the number of tracked touchpoints.
Quikly creates time- and quantity-bound promotional experiences that can run across a Shopify storefront, email, social, and SMS while matching the store’s brand presentation. Its mechanics have been refined across more than 60 million consumer interactions, and it can be evaluated with the same path-level and causal measurement discipline as any other promotional campaign.
The practical answer is to keep the model simple, audit the inputs, and let promotions earn budget through evidence rather than dashboard confidence.
If your Shopify reports disagree, start by mapping the observable journey against Shopify orders, then test whether your urgency promotion creates incremental, profitable demand. Explore Quikly to see how time- and quantity-bound promotional experiences can give shoppers a reason to act now without relying on blanket discounting.
Topics: multi touch attribution, attribution models, shopify marketing, marketing measurement, incrementality testing