

A DTC founder opens Shopify Analytics and sees a paid social campaign reporting 4.2x ROAS. The campaign looks healthy. Yet retention is flattening, contribution margin is tightening, and the brand keeps needing another promotion to maintain sales. The dashboard says the ads worked. The wider business is less certain.
That tension exists because reported revenue isn’t the same as causal revenue. An ad can receive credit for a purchase that would’ve happened through email, organic search, branded direct traffic, or an existing customer relationship. For a Shopify brand with limited margin, even a qualitative overstatement of paid media impact can lead to more spending on demand the business already owned.
Incrementality testing gives teams a different decision lens. It asks what would have happened without the campaign, then uses a randomized control group to estimate the lift caused by the treatment. The sections below cover the core method, practical test designs, sample calculations, channel-specific execution across Meta, Klaviyo, SMS, and onsite promotions, and the uncomfortable reasons incremental ROAS can diverge from platform-reported ROAS.
The Gap Between Reported ROAS and Real Lift
The founder in that opening scenario isn’t looking at a useless dashboard. Meta’s reporting can help with delivery, pacing, creative diagnostics, and directional campaign management. The problem starts when an attributed conversion is treated as proof that the ad created demand.
A platform typically observes that a person saw or clicked an ad and later purchased. That sequence establishes correlation. It doesn’t establish that the purchase wouldn’t have occurred without the ad. A returning customer searching for the brand, clicking a retargeting ad, and completing checkout may be counted as paid revenue even if the customer had already decided to buy.
The distinction matters most for channels that sit close to existing intent. Brand search and retargeting can look efficient because they intercept buyers who already know the product. Upper-funnel campaigns can face the opposite problem, because their influence may happen before a measurable click while other channels collect the final credit.
For a practical overview of how teams calculate and improve efficiency metrics, boost campaign ROI with Next Point Digital offers useful context on the difference between return calculations and the business decisions those calculations support. The same discipline applies here, but incrementality adds a counterfactual instead of relying on touchpoint credit.
Why the margin impact is easy to miss
Suppose a campaign’s platform revenue includes customers who would’ve purchased anyway. The media cost remains real, but some of the reported revenue isn’t caused by that media. A campaign can therefore appear profitable in an attribution dashboard while producing weak or negative incremental contribution after product, fulfillment, returns, discounts, and media costs.
That creates a familiar DTC trap. The brand sees a strong reported return, increases spend, then responds to weaker efficiency by adding a deeper offer. Margins shrink, customers learn to wait for promotions, and the team still hasn’t answered whether the original media created demand.
Practical rule: Treat platform ROAS as a reporting signal, not a budget authority.
The useful question is narrower and harder: what outcome changed because this marketing intervention was present? Incrementality testing is designed to answer that question. It can also reveal when creative, offer structure, or audience strategy is responsible for causal lift, rather than merely identifying which channel touched the order last.
What Incrementality Testing Actually Measures
Incrementality testing is a randomized controlled experiment that compares a group eligible for marketing exposure with a comparable group deliberately kept unexposed. The exposed group receives the ad, email, SMS, offer, or onsite experience. The control group doesn’t. The difference in outcomes estimates the campaign’s causal lift.
The counterfactual is the center of the method. For each treated audience, the test tries to estimate the result that would’ve occurred during the same period without the marketing intervention. That makes incrementality different from last-click attribution, which gives disproportionate credit to the final interaction, and from multi-touch attribution, which distributes credit across observed interactions without proving that any touchpoint changed behavior.
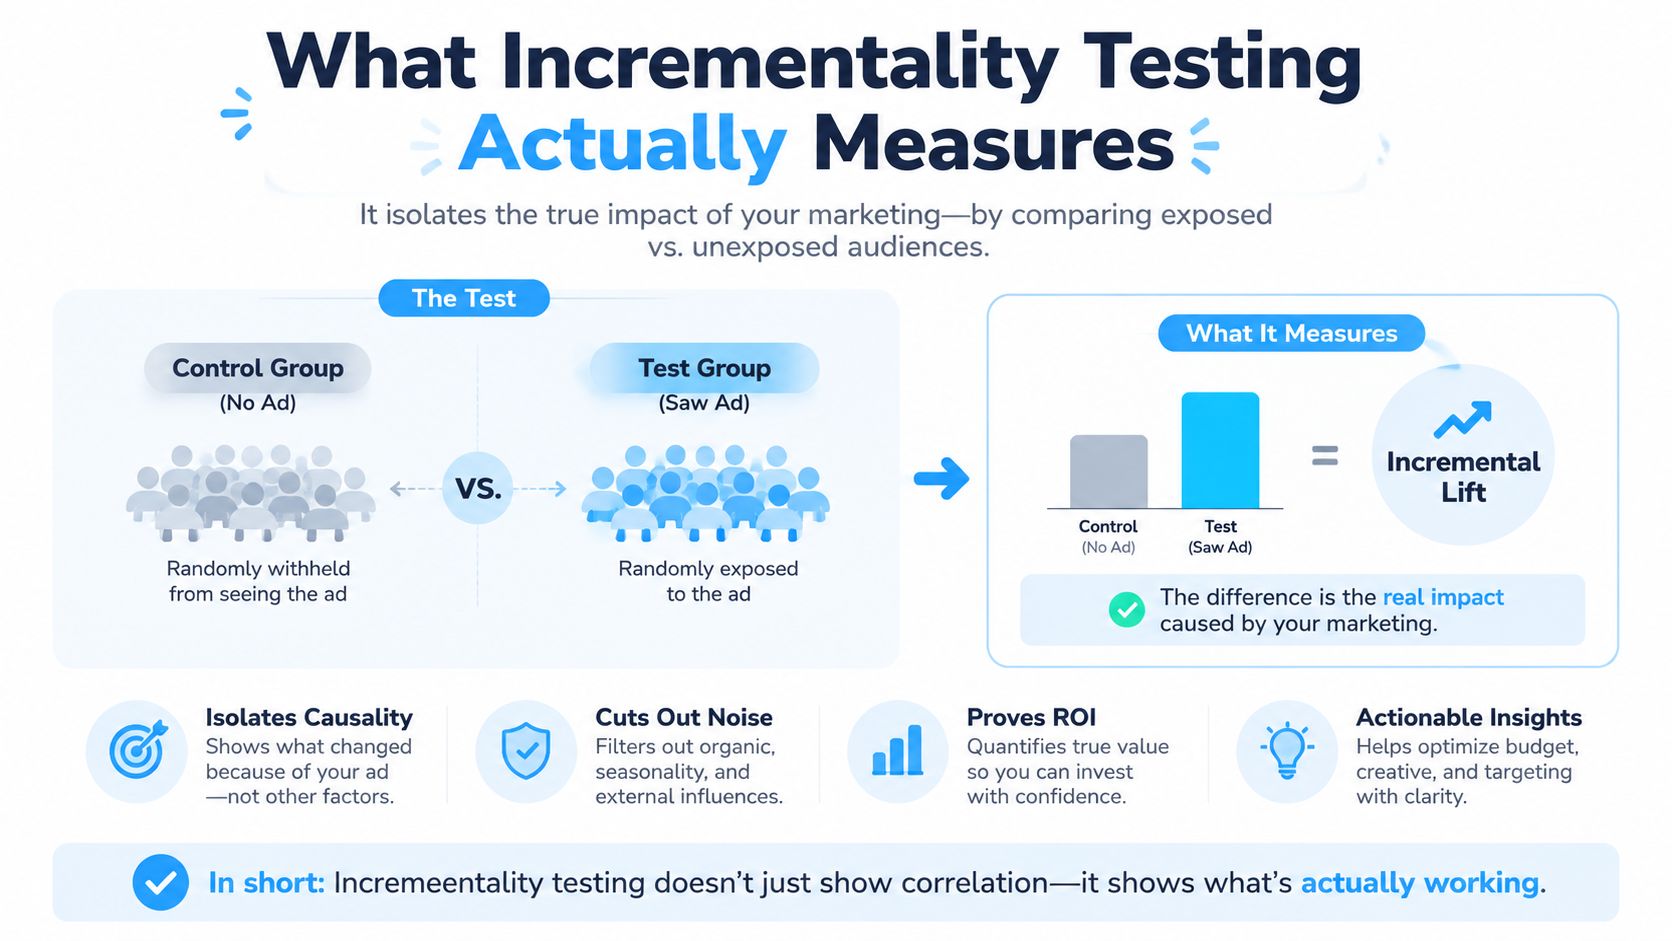
Three conditions make the result credible
Randomization gives each eligible unit a fair chance of entering treatment or control. The unit might be a user, household, account, or geography, but it must match how the channel delivers exposure.
A counterfactual creates the “without marketing” comparison. Without a holdout, a before-and-after comparison can confuse campaign impact with seasonality, promotions, inventory, price changes, or competitor activity.
A pre-registered success metric prevents the team from searching through many outcomes until it finds a favorable one. Choose the primary outcome before launch, document secondary metrics, and record guardrails such as refunds, unsubscribes, complaints, or profit.
Gross lift is the difference in observed outcomes between treatment and control. Net lift accounts for the control baseline and other adjustments that may be necessary, particularly in geo experiments. Incremental revenue translates the lift into a commercial outcome. For budget decisions, teams often use incremental ROAS, or iROAS, which compares incremental value generated by the treated campaign with the spend assigned to that treatment.
Google describes incrementality as a randomized, controlled experiment using exposed and unexposed groups to measure campaign impact, and notes that tests can focus on revenue, profit, or site and app actions across advertising channels (Google’s incrementality testing framework). Attribution still has operational value. It helps marketers manage journeys and optimize delivery. Incrementality is a separate lens for validating whether the spend changed the outcome at all.
The Main Methodologies and When to Use Each
No single incrementality method fits every Shopify brand. The right choice depends on audience size, channel reach, privacy constraints, geographic concentration, and the decision you need to make.
Audience-level holdouts
A holdout test randomly suppresses treatment from part of an eligible audience. The remaining audience stays eligible for exposure. This is usually the clearest starting point for a single channel or tactic because the comparison happens at the user or account level.
Use it for retargeting, Klaviyo flows, SMS sends, onsite offers, or paid campaigns where the platform can honor persistent exclusions. The method is especially useful for lower-funnel tactics, where reported attribution often captures existing intent.
Geo experiments
A geo experiment assigns regions, markets, or other geographic units to treatment and control. It works when individual-level suppression isn’t possible, including broad prospecting, television, out-of-home media, or campaigns that span multiple channels.
The trade-off is operational complexity. Regions need comparable pre-test behavior, and the analysis must account for population differences and baseline gaps. Practitioners often use matched treatment and control geographies, then apply pre-test normalization or difference-in-differences adjustments. Google also describes geo-based testing as a practical option for measuring revenue, profit, and site or app actions across campaigns (Google’s market-level incrementality guidance).
Conversion lift studies
Conversion lift studies are platform or vendor-managed experiments. Meta, Google, and measurement providers can supply the audience split and reporting workflow. They can be faster to launch than a fully custom test, but the brand has less control over the methodology, eligible inventory, identity resolution, and output definitions.
Choose this route when the primary question concerns a covered platform and the team needs a directional read without building the full experimentation layer internally.
Marketing Mix Modeling
MMM uses historical relationships between spend, revenue, promotions, seasonality, and other business variables to estimate channel contribution. It doesn’t create the same randomized counterfactual as a holdout, but it can help with planning when user-level tests aren’t practical and the brand needs a broader view of the media mix.
A workable decision rule is simple:
- Single channel and manageable audience: Start with a user-level holdout.
- Broad or offline reach: Consider a geo experiment.
- Platform-specific directional question: Use a conversion lift study.
- Complex channel mix and planning horizon: Add MMM, then calibrate it with experiments.
The strongest measurement stack usually combines methods rather than forcing one tool to answer every question.
Designing a Holdout Experiment Step by Step
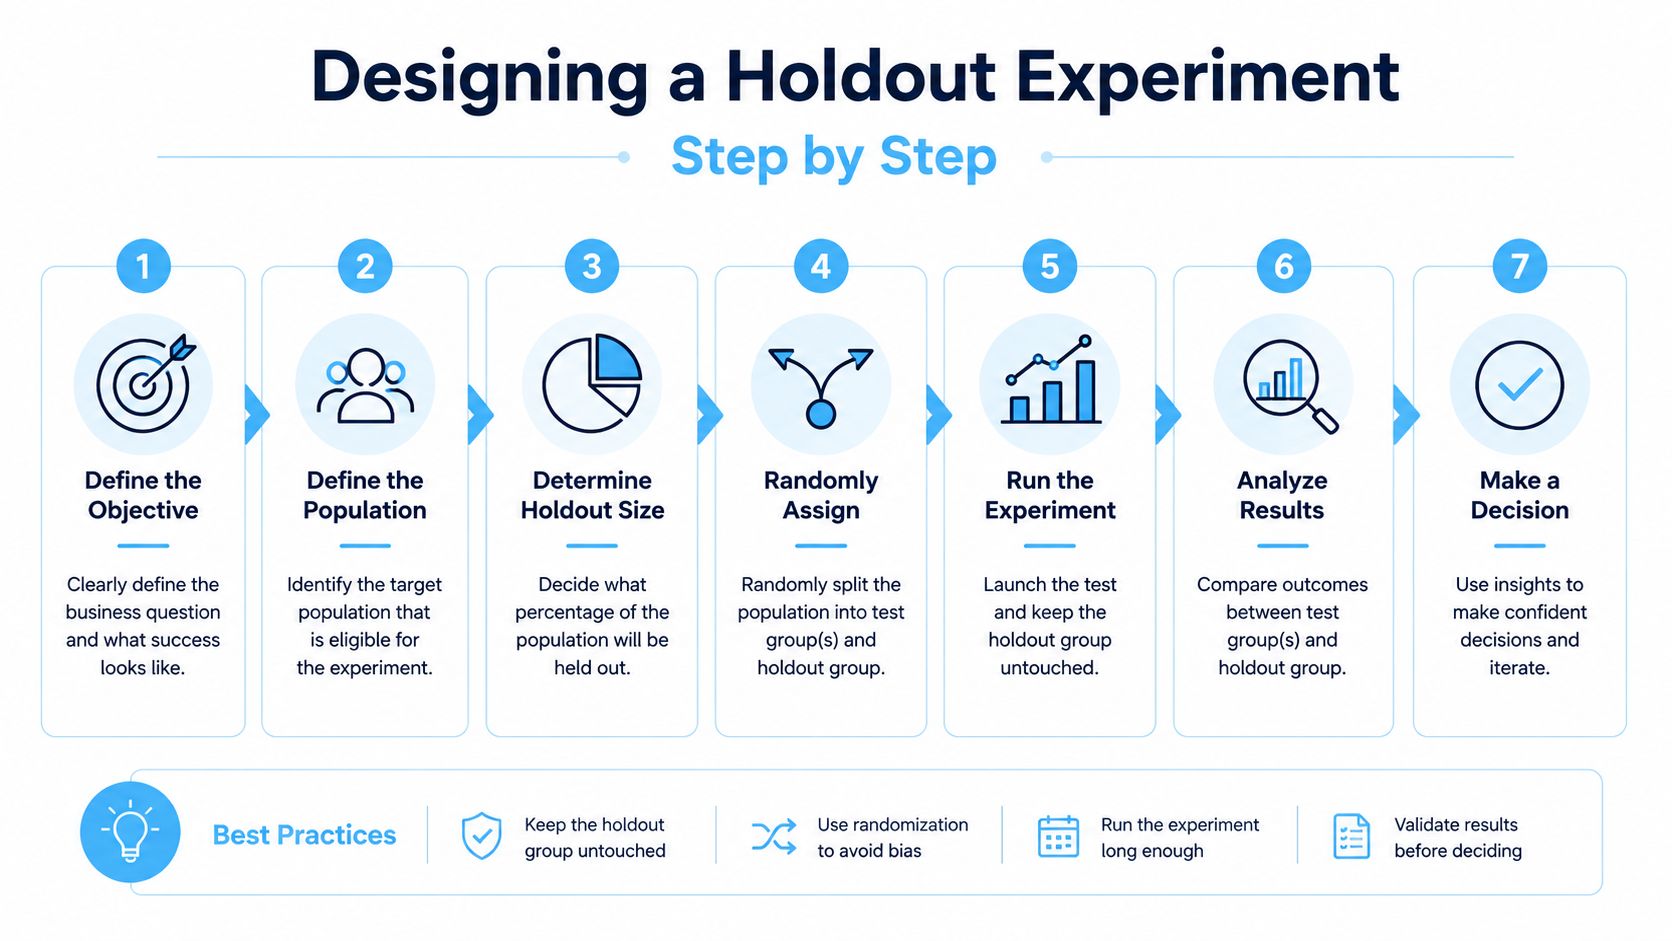
A clean test starts before anyone enters the audience builder. Write one falsifiable hypothesis, such as: excluding a defined share of eligible customers from Meta prospecting will reduce new-customer purchases, while remaining within agreed complaint and unsubscribe guardrails.
Keep the hypothesis specific enough to produce a decision. “This campaign will perform better” isn’t testable. “This treatment will increase incremental new-customer revenue per eligible user” gives the analyst a primary outcome and gives the finance team a commercial interpretation.
Seven design decisions that protect the result
-
Choose the randomization unit. Use a user, household, account, cart, or geography based on how exposure is delivered. Don’t randomize users if members of the same household can easily see the same offer through another account.
-
Assign treatment before launch. Create mutually exclusive groups and persist the assignment in a durable system. A shopper who moves between treatment and holdout during the test can contaminate the comparison.
-
Stratify where needed. Balance important characteristics such as acquisition source, region, customer status, and predicted value. Stratification reduces the chance that one group contains materially different demand before the campaign begins.
-
Plan sample size. Use baseline conversion, minimum detectable effect, significance level, and statistical power. A small holdout can be operationally convenient but commercially unreadable.
-
Set the duration in advance. Run through a complete purchase and attribution cycle. A short test can capture immediate clicks while missing delayed purchases, repeat orders, refunds, or returns.
-
Pre-register metrics and guardrails. Select one primary metric, then list secondary outcomes and safety checks. Revenue alone can hide margin loss, customer complaints, inventory pressure, or increased returns.
-
Audit exposure and contamination. Reconcile assigned users with actual sends and impressions. Document exclusions before analysis, then check seasonality, inventory constraints, novelty effects, and cross-channel spillover.
A pilot calculator such as Quikly’s pilot calculator can help frame the economics of testing before the team commits audience, spend, and analyst time. The calculator doesn’t replace power analysis, but it supports the basic commercial question: is the expected decision value large enough to justify the test?
Don’t stop when the early read looks favorable. Predefined stopping rules protect the result from random short-term movement and optimistic interpretation.
Sample Calculations and How to Read the Numbers
Assume 9,000 customers receive a campaign and 1,000 customers are held out. The exposed group produces 540 purchases, which is a 6.0% conversion rate. The holdout produces 45 purchases, or 4.5%. These figures are part of the worked example, not a benchmark.
The absolute lift is 1.5 percentage points, calculated as 6.0% minus 4.5%. Relative lift against the holdout baseline is 33.3%, calculated as the difference divided by the holdout conversion rate. Another commonly used incrementality expression is (test conversion rate minus control conversion rate) divided by test conversion rate, which estimates the share of observed test conversions associated with incremental rather than pre-existing demand (Measured’s incrementality testing explanation).
Turning lift into incremental orders
Apply the holdout rate to the exposed population:
- Expected orders without treatment: 9,000 × 4.5% = 405.
- Observed exposed orders: 540.
- Estimated incremental orders: 540 minus 405 = 135.
The next step requires discipline. If the campaign costs $4,500, incremental revenue is not automatically 135 multiplied by average order value. Use the chosen value definition, such as contribution margin after product and fulfillment costs, or a revenue figure that finance has approved.
If each incremental order contributes $70 after product and fulfillment costs, the incremental contribution is 135 × $70. Divide that value by campaign cost to calculate a margin-based return. If the team uses $135 of revenue as the value per order, the resulting ratio is 33.3, but that figure is only meaningful under that stated revenue assumption. The business case can change sharply when the denominator reflects profit instead of top-line revenue.
Read the interval, not just the point estimate. A lift estimate without a confidence interval can create false certainty.
A negative result means the intervention reduced the measured outcome. A result near zero may mean the tactic has little causal value, but it may also reflect an underpowered test, contamination, unstable eligibility, or an overly short purchase window. Statistical significance doesn’t establish that the tactic can scale. The team still needs to examine margin, capacity, customer quality, and whether the tested spend level resembles the proposed budget.
Running Incrementality Tests Across Ads, Email, SMS, and Onsite
The framework stays consistent across channels, but execution changes with reach and identity.
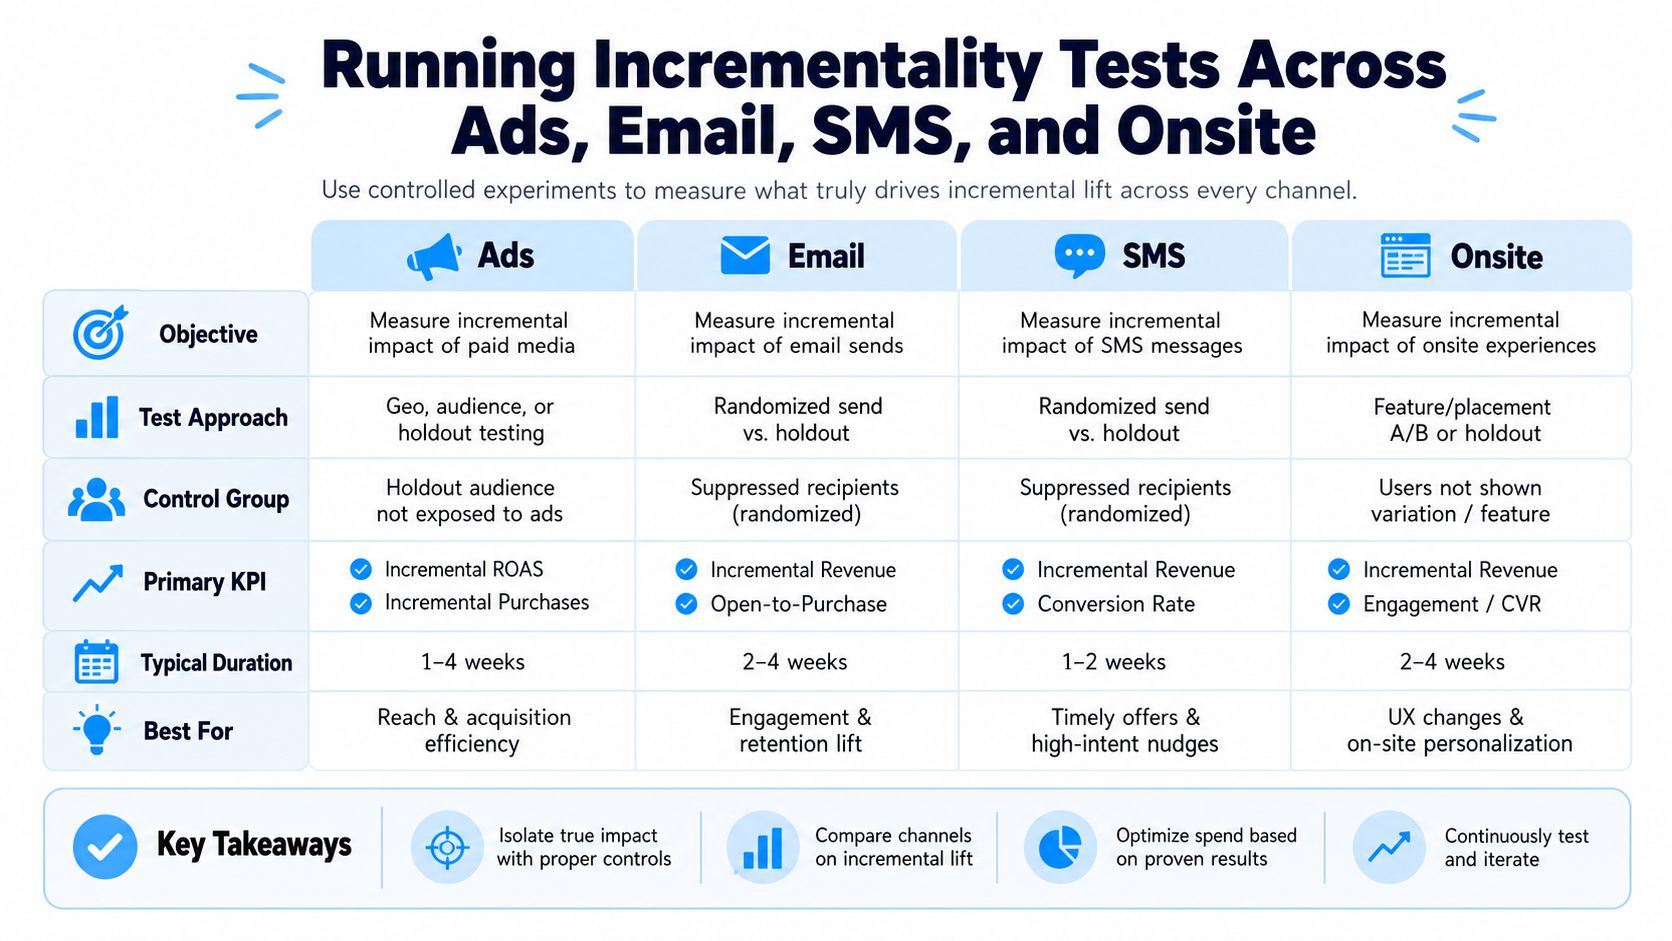
Paid ads need durable exclusions
For Meta or Google, use persistent user or household holdouts where platform identity and reach allow it. When individual assignment isn’t available, use a geo experiment. Coordinate exclusions with the ad platform and other paid channels, otherwise a control user may still receive the same message elsewhere.
Don’t judge the result only by attributed purchases inside the ad manager. Record spend, impressions, treatment assignment, orders, revenue, contribution, refunds, and returns in a shared measurement table.
Email and SMS require journey control
For email, split the eligible audience before send time using stable customer IDs. A holdout that receives the same offer through a welcome flow, browse abandonment sequence, or post-purchase journey isn’t a real control. Klaviyo’s campaign revenue can describe what happened after a send, but it can’t by itself prove that the send caused the purchase.
SMS audiences are smaller and often higher intent, so preserve enough holdout volume to produce interpretable orders. Monitor opt-outs, delivery failures, replies, quiet-hour rules, and message frequency as guardrails. Teams working on lifecycle strategy can also use this ecommerce email marketing resource for channel planning, while keeping causal measurement separate from engagement reporting.
Onsite experiences need consistent exposure logic
For banners, modals, offer bars, and personalized promotions, randomize at the browser or customer level. Exclude authenticated users if the experience depends on identity and would otherwise render differently across groups. Maintain the assignment across sessions so returning shoppers don’t switch conditions.
Quikly can be used to run time- or quantity-bound promotional experiences across the storefront, email, social, and SMS, with treatment and holdout measurement applied to the offer exposure. That makes the creative and margin question testable: does an earned, constrained incentive create additional action, or does it mainly discount shoppers who were already ready to buy?
Run tests sequentially when possible. If multiple teams change paid media, lifecycle messaging, onsite offers, and pricing during the same window, the result may show combined movement without identifying which intervention caused it.
Why Reported ROAS and Incremental ROAS Diverge
A high reported ROAS often means a channel touched demand. It doesn’t necessarily mean the channel created that demand.
Five mechanisms produce the gap:
- Last-click credit: The final paid click receives credit even when earlier brand intent drove the purchase.
- View-through windows: A later conversion can be associated with an ad impression without a direct response.
- Organic overlap: Buyers who would’ve used organic search, direct traffic, or email remain inside the paid audience.
- Audience saturation: Repeated exposure reaches people already familiar with the brand.
- Cross-channel cannibalization: Paid social, branded search, email, and SMS compete for the same conversion.
Recent coverage reports that measured incremental ROAS is typically 30% to 60% below platform-reported ROAS, with the widest gaps in brand search and retargeting (AdBeacon’s coverage of the incrementality gap). The implication is practical, not merely statistical. A channel can have excellent attribution and weak causal value at the same time.
Consider a campaign reporting 4.50 ROAS. A holdout reveals that much of the treated audience would’ve purchased without the ads, leaving 1.90 incremental ROAS after intercepted demand is removed. The campaign didn’t necessarily fail. It may still be useful for reach, creative learning, or supporting other channels. But it shouldn’t receive the same budget as a campaign producing 4.50 in causal return.
Ask two questions for every channel:
- Could this audience reach the brand without paid exposure?
- Would the buyer likely have purchased during the test window anyway?
Attribution modeling remains useful for understanding touchpoint paths, but this guide to attribution modeling shouldn’t be mistaken for a causal experiment. Set budget thresholds using iROAS, contribution margin, and customer quality. Use reported ROAS to diagnose delivery, not to overrule evidence from a clean holdout.
Building a Testing Portfolio and Next Steps
A Shopify team doesn’t need a measurement laboratory before running its first useful experiment. Start with one major paid channel, define the business decision, set a guardrail, and commit to the rule before results arrive.
A practical portfolio can combine persistent holdouts for paid channels, periodic geo or public service announcement tests for upper-funnel media, and lightweight conversion-lift studies for creative changes. Google reports that the minimum spend required for some tests has fallen from about $100,000 to $5,000, widening access beyond enterprise advertisers (Google Ads guidance on incrementality testing). Industry coverage also reports that 52% of brands and agencies use incrementality testing, while IAB guidance is moving toward a hybrid measurement approach that combines experiments, counterfactual models, econometrics, and proxy metrics, as described in the same Google resource.
The measurement stack is shifting toward portfolios rather than one universal method. Experiments can calibrate MMM, cleaner data pipelines can support smaller geo cells, and AI-assisted design may help pre-screen hypotheses for detectable effect size. Those tools still depend on sound assignment, stable exposure, and honest decision rules.
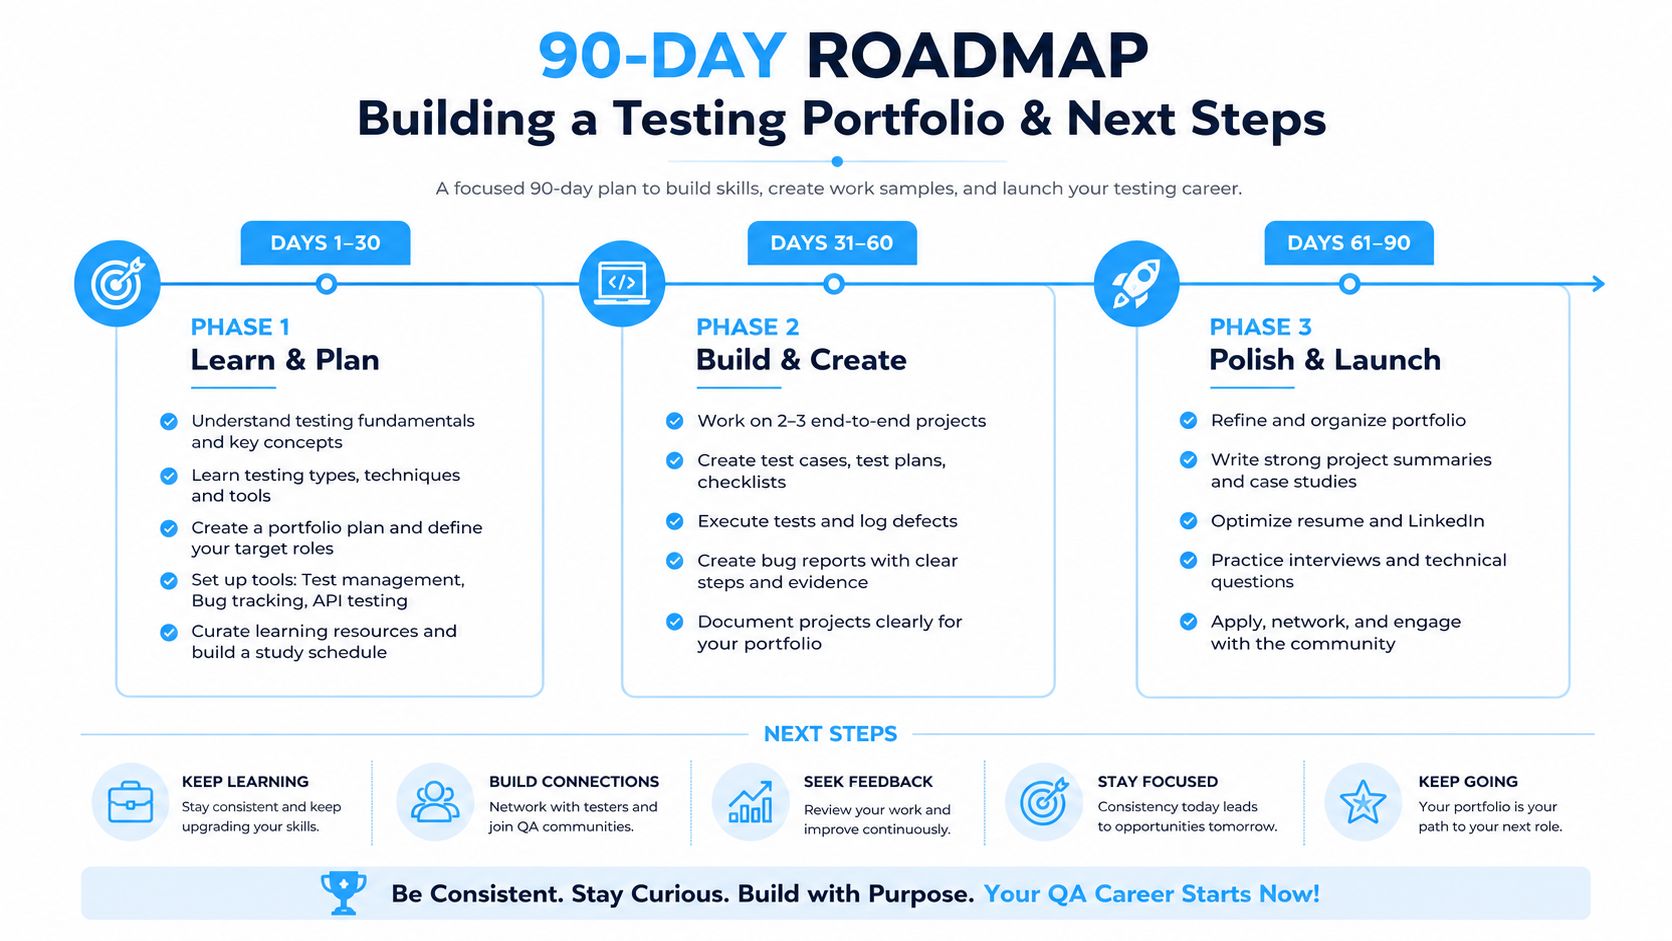
Pick one channel this quarter. Write the hypothesis, choose the primary margin or revenue metric, set a guardrail, and decide in advance what result will lead to scaling, revision, or a pause.
Quikly helps Shopify brands turn flat promotions into time- and quantity-bound experiences that can be measured against a holdout for incremental lift, rather than judged only by attributed revenue. Visit Quikly to see how controlled urgency can support conversion while protecting margin and brand value.
Topics: incrementality testing, holdout testing, DTC measurement, Shopify marketing, incremental ROAS