Most advice on how to calculate average order value stops at one line of arithmetic, as if the hard part were division. It isn’t. The hard part is deciding what counts as revenue, which orders belong in the denominator, and whether a higher average left you with more profit.
Two Shopify reports can show two different AOVs for the same month, and both can be arithmetically correct. If you don’t know which definition you’re reading, you can credit a promotion for lifting baskets when it only deepened discounts, or kill a campaign that brought in healthy new buyers with smaller first orders.
The AOV Formula and Worked Examples
AOV = Total Revenue ÷ Number of Orders
That’s the whole formula. The Shopify guide to average order value uses $2,000 in revenue from 100 orders to produce an AOV of $20, with revenue and orders taken over the identical period.
The period match matters more than operators admit. Weekly revenue divided by a monthly order count produces a number, but it doesn’t describe any real basket. Use the same week, month, quarter, or campaign window for both inputs.
Worked AOV examples
| Scenario | Revenue used | Orders | AOV |
|---|---|---|---|
| Basic revenue example | $2,000 | 100 | $20 |
| Shopify sales report, net of discounts | $800 | 10 | $80 |
| Your store, last 30 days | Your net revenue for 30 days | Your orders for 30 days | Revenue divided by orders |
Look at the second row closely. Gross sales of $1,000 would suggest $100 per order across 10 orders. Once you subtract $200 in discounts, the revenue used is $800 and AOV falls to $80. Same orders, same checkout activity, different answer because the numerator changed.
Practical rule: Run the third row now with your own last 30 days. A definition you haven’t applied to your own store is just vocabulary.
AOV is also an order-level metric, not a customer-level metric. One customer who places three orders adds three to the denominator, not one. That makes AOV useful for judging merchandising, bundles, cross-sells, shipping thresholds, and campaigns, but weak for judging customer value on its own.
I would treat any single AOV figure as a starting point for how you improve transaction-level efficiency, not as proof that efficiency improved. A campaign can raise total revenue while attracting many low-value orders that pull AOV down. Another can produce fewer, larger baskets and push AOV up while total orders fall. You need both inputs visible, every time.
Which Revenue and Orders Belong in the Count
One store can report several AOVs without anyone making a math error. The gap lives in the numerator and denominator. Pick the wrong version for a campaign decision and you’ll compare baskets that were never measured the same way.
The Shopify sales report documentation defines AOV as (Gross Sales − Discounts) ÷ Orders, excluding taxes, shipping, and post-order adjustments such as returns, edits, or exchanges. Its December example uses $1,000 in gross sales minus $200 in discounts, divided by 10 orders, for an AOV of $80, not $100.
AOV definitions and when to use each
| Definition | Revenue counted | Left out | Use it for |
|---|---|---|---|
| Shopify sales report AOV | Gross sales minus discounts | Taxes, shipping, returns, edits and exchanges | Campaign and period tracking |
| Shopify marketing report AOV | Order value before returns, including taxes, shipping and discounts | Orders made only of gift cards | Comparing channels and ad performance |
| Ordered AOV | Net product revenue at checkout divided by completed orders | Refunds and cancellations that arrive later | Judging checkout offers |
| Realized AOV | Revenue after refunds, cancellations and returns, divided by applicable orders | Amounts removed by refunds, cancellations and returns | Judging profit after returns |
Tax and shipping inflate the apparent basket because they’re often pass-through charges, not product revenue you keep. Two identical product baskets shipped to different tax jurisdictions shouldn’t look like different merchandising results. Pre-discount sales create the opposite distortion by making a promotion look more valuable than the cash collected.
Clean the denominator too. Remove test orders before you calculate, and decide in advance how you’ll treat gift-card-only orders. A handful of test checkouts won’t wreck a high-volume store, but they’ll distort a small campaign test.
For campaign work, I would default to the sales report definition for the headline figure and track realized AOV alongside it once returns settle. Write the chosen definition on the reporting sheet and apply it to baseline, campaign, and post-campaign periods without exception.
Add contribution margin per order as the companion metric. A higher AOV can coexist with lower profit when discounts run deep, and margin per order is where that trade-off becomes visible.
How to Calculate AOV in Shopify Step by Step
The process below uses the sales report definition. It takes a few minutes in Shopify Analytics, and most errors come from dates or report choice, not arithmetic.
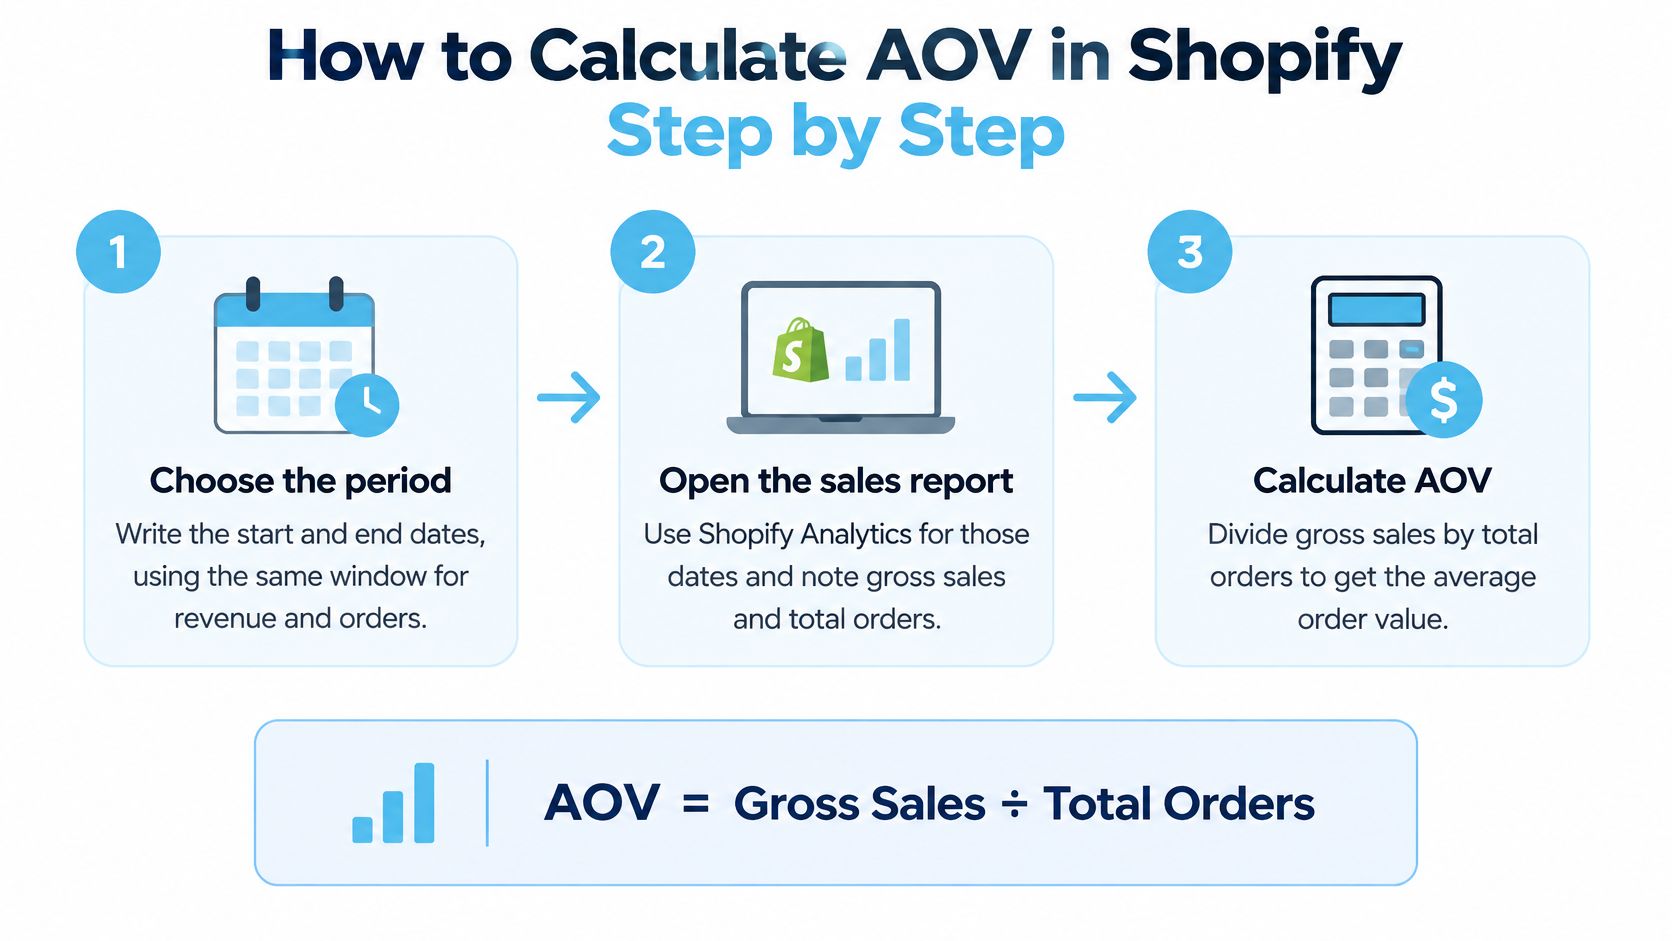
- Choose the period. Write the start and end dates down. Revenue and orders must come from that exact window.
- Open the sales report. In Shopify Analytics, pull the sales report for those dates and note gross sales and total discounts.
- Note the order count. Take it from the same report and same dates. Don’t pull orders from the Orders page with a different filter.
- Confirm the report choice. The Shopify marketing reports documentation calculates AOV by dividing qualifying order value by orders containing at least one product other than a gift card, including taxes, shipping, and discounts before returns. Use that version for channel comparisons, not as a substitute for sales report AOV.
- Subtract discounts from gross sales. The result is your net product revenue for the numerator.
- Divide net revenue by orders. Round to two decimals. That’s your AOV for the period.
- Label the figure. Write the definition next to it, for example “sales report, net of discounts.” Unlabeled numbers get mixed later.
- Repeat for the prior period. Use identical steps and an equal-length window to create your baseline.
Check your work before you trust it
Multiply your AOV by the order count. The result should reconcile to the net sales total you started with. If it doesn’t, check dates and definitions first. The formula is rarely the problem.
If two reports disagree, don’t average them. Find which definition each one uses and keep the one that matches your decision.
You can run the same steps with a channel or device filter to get a segment AOV. In Google Analytics 4, divide purchase revenue by purchases over the same dates, but confirm whether that revenue includes tax and shipping before comparing it with your Shopify figure. Tools disagree when you let them.
Track Baselines, Campaigns and Segments
AOV means nothing without a comparison. A single number tells you the average size of recent baskets. It doesn’t tell you whether a promotion changed behavior, or whether last month’s mix of traffic did.
Build the comparison before you launch anything. You need a baseline window before the campaign, the campaign window itself, a control, and a post-campaign check after returns and novelty effects settle.
Campaign tracking template
| Period | Date range | Orders | Revenue | AOV |
|---|---|---|---|---|
| Baseline, four weeks before launch | 28 days ending the day before launch | Order count for those dates | Net revenue for those dates | Revenue divided by orders |
| Campaign window | Launch date to campaign end date | Order count for those dates | Net revenue for those dates | Revenue divided by orders |
| Control group or same days last year | Same dates as the campaign window | Order count for the control | Net revenue for the control | Revenue divided by orders |
| Post-campaign check, four weeks after | 28 days starting after the campaign ends | Order count for those dates | Net revenue for those dates | Revenue divided by orders |
The control is where discipline pays. Compare shoppers exposed to the campaign with a comparable unexposed group when you can. When seasonality is strong, the same days last year are a better reference than the quiet month before a peak launch.
Blended averages hide the segments that moved. Split AOV by new versus returning customers, mobile versus desktop, sales channel, country, and product category. A campaign can lift returning customers while new buyers shrink the blended average, and only the split shows you which story is true. Our breakdown of analytics for e-commerce covers how to structure that reporting cadence.
- Keep a definition log. Record the label next to every figure you save.
- Compare equal lengths. A 10-day campaign against a 30-day baseline invites weekday mix problems.
- Wait past week one. Early results overrepresent your most responsive customers.
- Note concurrent changes. Log other promotions, price edits, and stockouts in the same sheet.
- Allow for late returns. Realized results need time after the window closes.
Reading Changes in AOV Without Fooling Yourself
The common assumption is simple. AOV went up, so shoppers are buying more. That assumption fails often enough that you shouldn’t act on it without two extra checks.
AOV is a mean, and order values are often right-skewed. The Liquid Web guide to improving average order value makes the point that a small number of unusually large orders can raise AOV while most shoppers spend less. A few wholesale-like baskets can move your average while the typical customer’s behavior doesn’t change at all.
That is why you pair AOV with the median order value and distribution percentiles. If the mean rises and the median moves with it, broad behavior shifted. If the mean rises alone, a small group of large baskets did the work. Tracking this by customer group over time, the way cohort analysis works, shows whether the shift lasts or fades after the campaign ends.
AOV patterns and what they usually mean
| Pattern | Likely cause | Check next |
|---|---|---|
| AOV up, order count down | A threshold or bundle drew fewer, larger baskets | Revenue and contribution margin per order |
| AOV up, median flat | A few large orders are skewing the mean | Median and order distribution by segment |
| AOV down, revenue up | Discounts brought in new buyers with smaller baskets | Realized AOV after returns, and margin |
| AOV up, margin down | Deeper discounts inflated basket size | Discount cost per order against the control group |
The sharper campaign test has four parts. Did realized AOV rise against a comparable control? Did the refund rate hold? Did discount cost per order stay within plan? Did contribution margin per order improve, or at least hold?
A promotion that raises the average by giving back more margin than it creates hasn’t grown the basket. It has rented one.
Thresholds and bundles are the usual suspects here. Both can lift checkout AOV through loss aversion, since shoppers work to avoid missing a reward they’ve nearly reached. Both can also increase the effective discount until margin per order falls. The tactic isn’t the problem. Measuring only the average is.
Watch the reverse case too. AOV can fall while revenue rises because new buyers arrive with smaller first baskets. If margin holds and those buyers return, that’s healthy growth wearing a bad headline number. Report mean, median, order mix, and margin together, and you’ll stop having that argument from a single metric.
Set Your Own AOV Baseline Before Chasing Benchmarks
Benchmarks are context, not targets. The Shopify guide to basic ecommerce metrics reports a global ecommerce AOV benchmark of $185 from Dynamic Yield over the preceding 12 months, while noting that category, geography, pricing, traffic source, and revenue definition all change the result. A supplements brand and a furniture brand shouldn’t chase the same number.
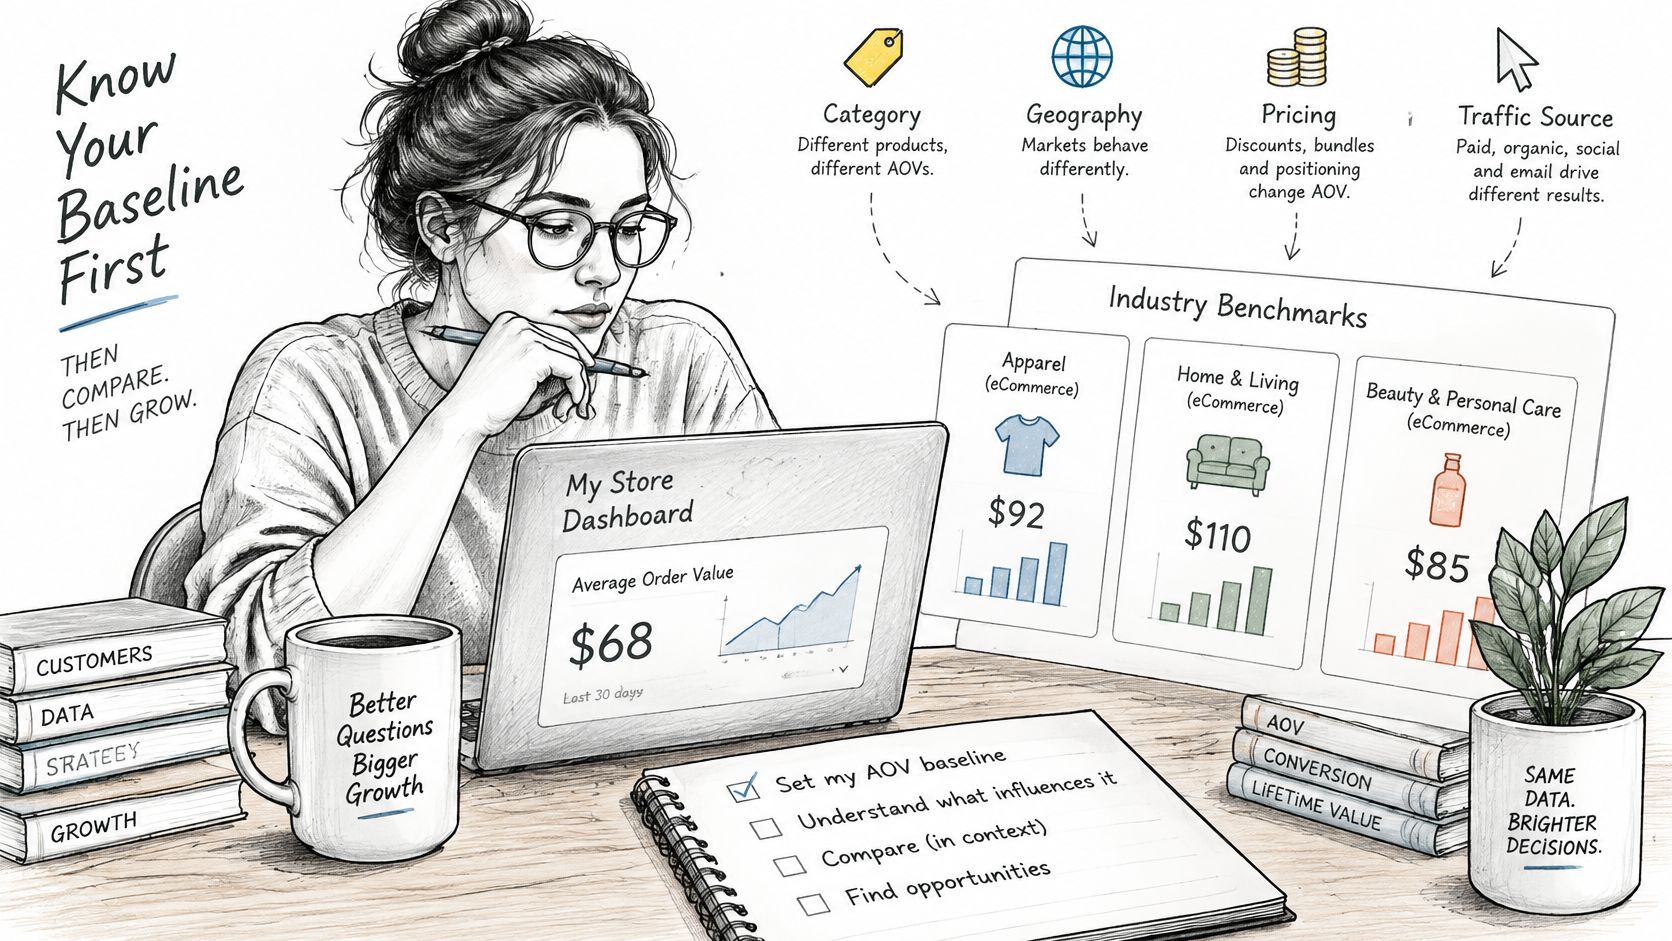
Build your own baseline instead, as part of the wider set of ecommerce performance metrics you review weekly.
- Calculate the last 90 days. Use the one definition you picked for campaign work.
- Split it. Break the figure by channel and by new versus returning customers.
- Record the median. Save it next to the mean so skew is visible later.
- Save the baseline. Put it in the reporting sheet with its definition label and dates.
Then choose a test aimed at basket size rather than a deeper blanket discount. Set a margin guardrail in advance, such as a minimum contribution margin per order the test can’t breach. Quikly’s Grow average order value solution lifts the basket without discounting the store, and the ROI Calculator projects incremental sales, orders, and discount savings from a 30-day campaign using your own numbers, so the test starts from your baseline rather than a generic benchmark.
The goal was never a larger average for its own sake. It’s more profit per order, earned without training customers to wait for the next markdown.
Once your baseline is set, Quikly can help you test against it with time and quantity bound promotional experiences that reward shoppers for acting now instead of discounting the whole store. You’ll see whether realized AOV and margin per order move against your own numbers, and you can project a 30-day campaign before you commit.
Topics: average order value, AOV formula, Shopify AOV, calculate AOV, AOV analytics