
You send a campaign, glance at the dashboard, and see a decent open rate. The subject line worked, at least on paper. Then you pull Shopify revenue, and the lift is soft, the offer had to work too hard, and unsubscribes ticked up again.
That gap is where most email reporting fails Shopify brands. It rewards the easiest number to celebrate, not the number that tells you whether your email program is helping conversion, protecting margin, and keeping the brand out of the discount trap.
The evaluation of email performance should work more like an audit than a scoreboard. You need to know whether the message reached the inbox, whether real people engaged, whether the click path drove a purchase, and whether the send trained customers to buy now or wait for the next promo.
Why Most Email Reports Mislead Shopify Brands
A common Shopify pattern looks like this. The team is sending more often because paid traffic is expensive and onsite conversion isn’t where it needs to be. Campaign opens look fine. Revenue per send feels inconsistent. So the reaction is predictable: push harder on subject lines, add urgency language, increase promo frequency, maybe deepen the discount.
That usually treats the symptom, not the problem.
Open rate can look healthy while the email underperforms
Email has always been measurable, and that habit runs deep. Teams still judge campaigns by familiar benchmarks like open rate, click-through rate, bounce rate, and inbox placement. Recent benchmark reporting shows average open rate at 20.73% excluding Apple Mail Privacy Protection, or 33.87% including it, and average global inbox placement at 87.2%, which means roughly 1 in 8 emails did not land in the inbox according to Brevo’s email marketing benchmarks.
Those numbers matter, but they don’t mean what many teams think they mean.
Apple Mail Privacy Protection changed how open tracking behaves. Mailbox filtering also got stricter. So an “improving” open rate can coexist with flat clicks, weak conversions, and poor inbox placement at key providers. If you’re still running your program by opens first, you’re optimizing for a signal that’s become noisier and less tied to cash.
Practical rule: If revenue is flat and opens are rising, don’t celebrate yet. Check whether the traffic, orders, and inbox placement moved with it.
Wrong metrics lead to expensive decisions
This isn’t just an analytics problem. It’s a margin problem.
When teams trust flattering top-line metrics, they often compensate for weak downstream performance by increasing send volume or making the offer more aggressive. That can create a bad loop. Customers learn to wait for promotions. Brand perception softens. Discounts start doing work that the message and the experience should have done.
For a sharper view of what to measure across channels, Quikly’s guide to ecommerce performance metrics is worth keeping nearby because email shouldn’t be judged apart from the profit conversation.
Good evaluation of email has four jobs
A useful email report answers four different questions:
- Delivery quality: Did mailbox providers let the message into the inbox?
- Engagement quality: Did recipients click, not just register an open?
- Attribution truth: Did email drive the order, assist it, or just happen to be in the path?
- Testing discipline: Did the team learn something reliable, or just declare a winner too early?
If your dashboard can’t answer those four, it isn’t helping you make better decisions. It’s just making the weekly report look busier.
The Email Performance Funnel You Should Actually Measure
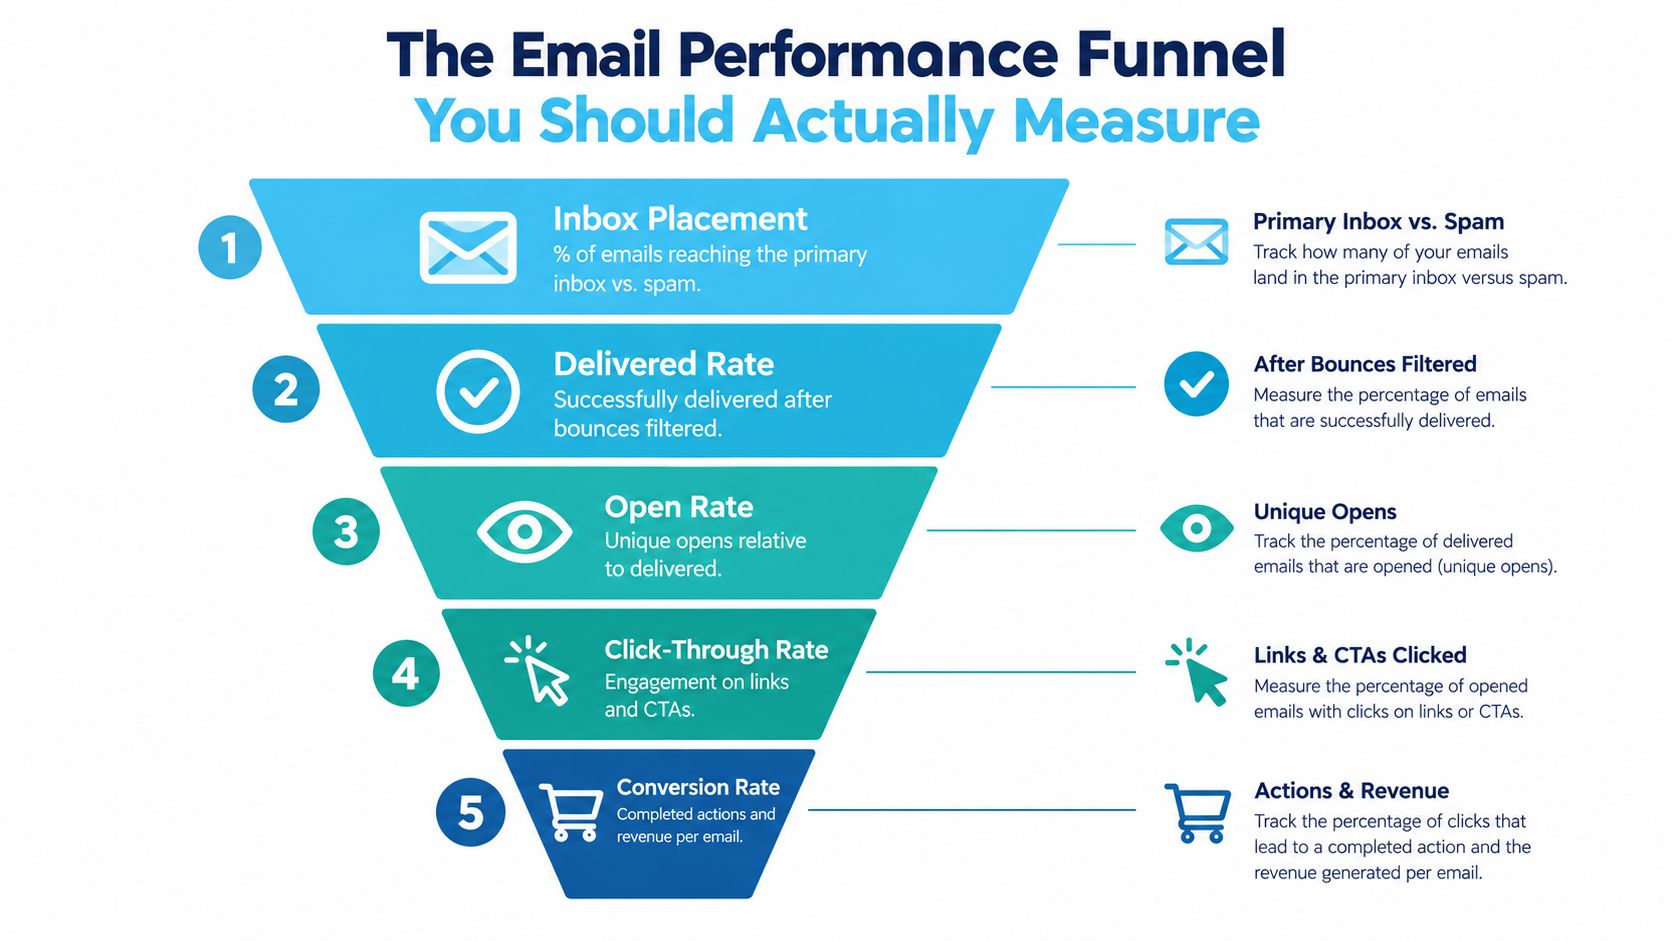
The cleanest way to evaluate email is to treat it as a funnel. Not one metric. Not one screenshot from Klaviyo. A funnel.
Start with inbox placement, not sends
The first question isn’t whether the platform says the email was delivered. It’s whether the message reached the inbox where a customer could realistically evaluate it.
Independent testing across major providers reported average deliverability at 83.1%, with about 16.9% of legitimate marketing emails failing to reach the intended inbox. Roughly 10.5% landed in spam and 6.4% went missing entirely according to this deliverability summary. That is why “delivered” status can give a false sense of security.
If inbox placement is weak, creative optimization is premature.
Then look at delivered rate and open rate for what they actually prove
Delivered rate still matters because hard bounces and blocks tell you whether your list and sending setup are stable. But delivered isn’t the finish line. It’s just basic eligibility.
Open rate sits one step lower in the funnel. It tells you whether your sender name and subject line were strong enough to earn attention, but only loosely. In a privacy-distorted environment, open rate should be treated as directional, not decisive.
A benchmark set covering more than 3.6 million campaigns reported an average open rate of 43.46% according to VerifiedEmail benchmark reporting. On its own, that doesn’t tell you much about business impact.
Click-through rate and click-to-open rate are where content starts telling the truth
Click-through rate shows whether the email moved someone from passive exposure to action. Click-to-open rate goes one level deeper. It asks: among the people who appeared to open, how many found the content compelling enough to click?
That distinction matters because CTOR is often more diagnostic of content quality than raw open rate in modern email environments, and common guardrails also put bounce rate below 2%, unsubscribe rate below 0.5%, and spam complaints below 0.1%, with some experts recommending 0.02% or lower, as noted in HubSpot’s email metrics guidance.
Track CTOR when you’re evaluating body copy, layout, product selection, and CTA clarity. Track open rate when you’re evaluating sender and subject line. Don’t mix the jobs.
Conversion rate and revenue per recipient finish the funnel
Recent benchmark data highlights the gap between visible engagement and actual business value. In that set, median open rate was 43.46%, while average CTR was 2.09%, CTOR was 6.81%, and conversion rate was 0.08% according to Sender’s email marketing statistics. That’s the funnel in plain view. Opens can look healthy while downstream impact stays weak.
For Shopify merchants, the bottom of the funnel should end with two business questions:
- Did the email generate orders?
- How much revenue did it produce per recipient, relative to the strength of the offer?
A campaign that gets fewer opens but better click quality and stronger revenue per recipient is the better campaign. A campaign that wins on opens but needs a heavier discount to convert may be the worse one, especially if you’re training customers to wait for markdowns.
How to spot the real bottleneck
Review the funnel in order and look for the steepest drop.
- Weak inbox placement: Fix sending reputation and provider-specific placement first.
- Strong opens, weak clicks: The subject line worked, the content or offer didn’t.
- Strong clicks, weak conversions: The landing page, product-page continuity, cart friction, or offer economics need work.
- Strong conversion, weak revenue quality: You’re probably overpaying with the discount.
That sequence keeps the evaluation of email tied to profit, not vanity.
Diagnosing Deliverability and List Health Before You Optimize Content
If your email isn’t reaching the inbox, your best copywriter can’t save it.
A lot of teams lose weeks here. They workshop subject lines, redesign modules, and tweak CTAs while Gmail or Yahoo is already telling them the issue is reputation, authentication, complaints, or list quality.
Look at placement by mailbox provider
Deliverability isn’t binary. It isn’t “sent” versus “failed.” The useful view is inbox, spam, and missing, broken out by provider.
Validity’s 2026 benchmark found global inbox placement averaged 87.2% in 2025, while Gmail and Yahoo era sender rules expect spam complaints below 0.1% and never above 0.3%, according to the Validity benchmark report. That means your aggregate deliverability number can hide a real provider-specific problem.
If Gmail placement is weak but Microsoft placement is stable, don’t average them together and call it fine. Audit by provider.
For operators who want a practical refresher on the moving parts, this email deliverability guide from mailX is a useful walk-through of the checks worth reviewing before you blame creative.
Check the technical and behavioral guardrails
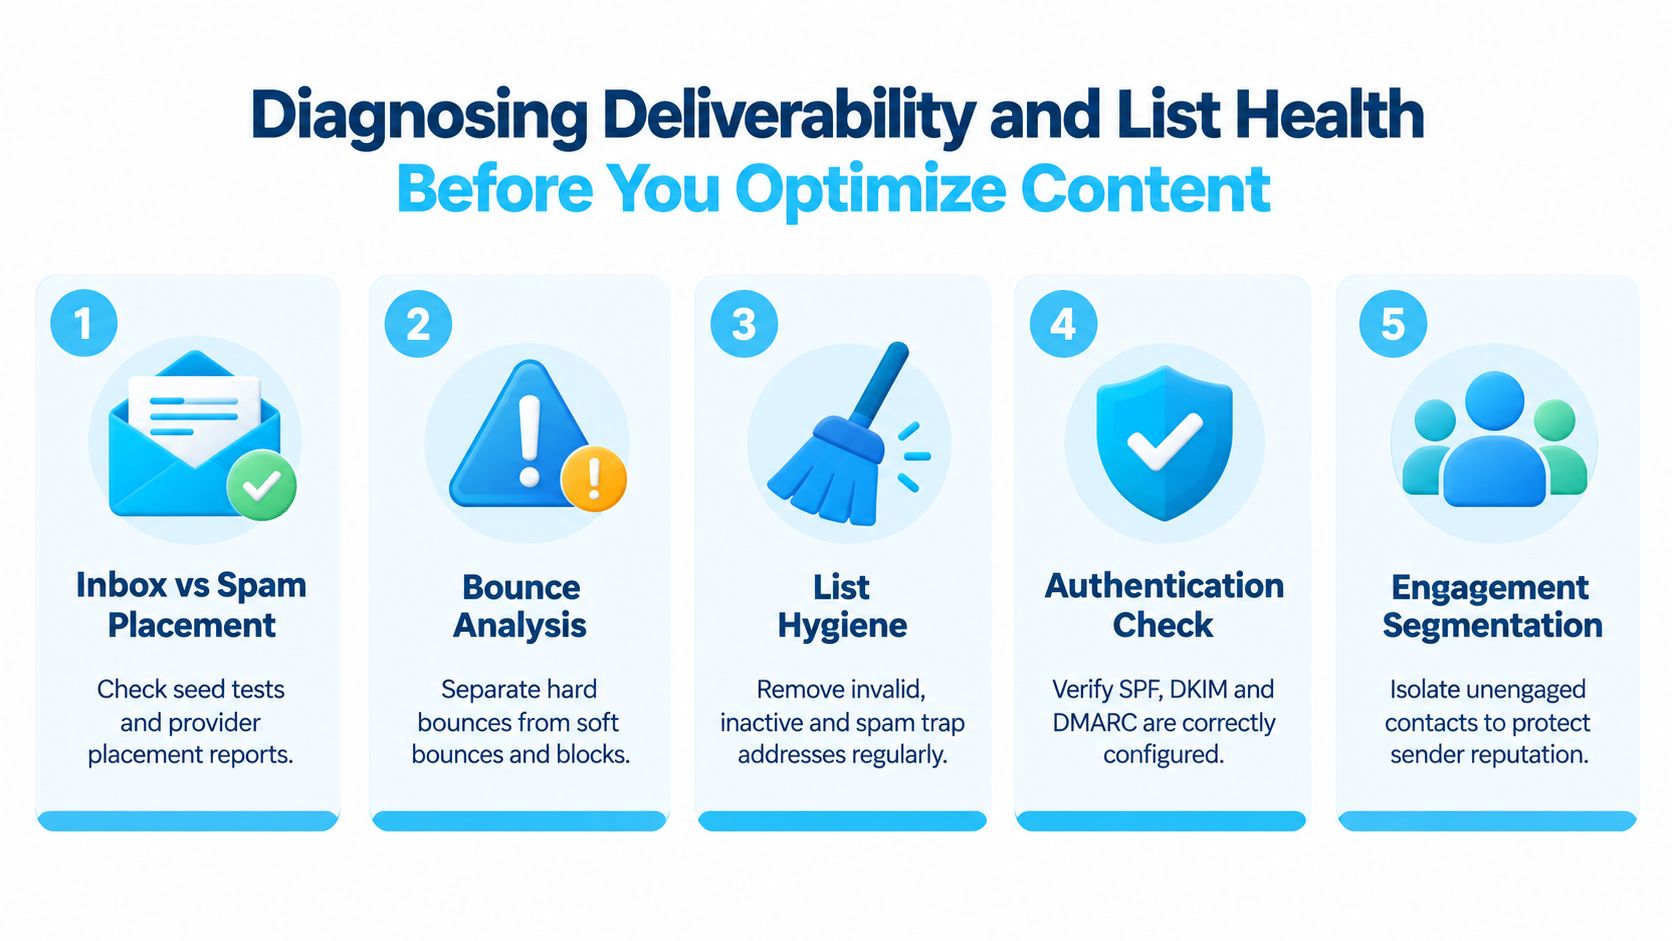
Deliverability comes down to two categories. Setup and behavior.
Setup checks
- Authentication: Confirm SPF, DKIM, and DMARC are in place and aligned with your sending tools.
- Infrastructure consistency: Make sure your campaign and flow sends aren’t creating mixed signals through different domains or inconsistent practices.
- Provider reporting: Review the placement and reputation signals available through your ESP and provider tools.
Behavior checks
- Spam complaints: Keep them comfortably below accepted guardrails, not barely under them.
- Bounce rates: Hard bounces are often a list-quality warning, not just a cleanup chore.
- Unsubscribes: A spike after promotional sends usually says more about targeting, frequency, or offer fatigue than copy.
Quikly’s article on improving email open rates is useful only after these fundamentals are under control. Subject line work matters. It just doesn’t fix a reputation problem.
Inbox problems often show up as content problems in dashboards. That’s why so many teams “optimize” the wrong layer.
Run a simple deliverability audit sequence
Use a short sequence instead of a sprawling checklist.
- Check inbox placement by provider. Separate inbox, spam, and missing where possible.
- Verify authentication and sender consistency. Don’t assume this is stable because it was set up once.
- Review complaint, bounce, and unsubscribe patterns. Promotional blasts often expose list weakness faster than flows do.
- Suppress or re-engage low-quality segments. Stop mailing the coldest names at the same intensity as active buyers.
- Only then revisit creative. Once reach is stable, test subject lines, layout, and offer framing.
The payoff is simple. You stop trying to solve inbox eligibility with prettier emails.
Attribution That Tells the Truth About Email Revenue
Email revenue gets overstated in some dashboards and understated in others. Both mistakes are expensive.
A Shopify brand running Klaviyo, Shopify analytics, and paid social usually has several competing stories about the same order. One report says the campaign drove the sale. Another says direct or paid search closed it. A third gives credit to an automated flow the shopper touched days earlier.
Different attribution lenses answer different questions
The problem isn’t that one model is always wrong. It’s that teams use one lens for every decision.
| Attribution Lens | What It Credits | When to Use It | Risk If Misused |
|---|---|---|---|
| Last-click | The final channel or touch before purchase | Evaluating closing power on short purchase paths | Over-credits whatever happened to be last, usually campaigns and branded traffic |
| Open-based | Revenue from recipients who opened | Quick directional checks when click tracking is incomplete | Inflates email impact because opens are noisy and don’t prove intent |
| Click-based | Revenue from recipients who clicked | Assessing traffic quality from a specific email or CTA path | Understates assist value from emails that influence without getting the final click |
| Assisted revenue | Revenue where email was part of the path | Understanding lifecycle impact, especially flows | Can get fuzzy if you treat every touch as equally persuasive |
| Revenue per recipient | Revenue divided by audience reached | Comparing campaign quality across different send sizes and offer levels | Misses context if used without margin and audience quality review |
Use the attribution lens that matches the question
If you’re asking whether a campaign closed demand, last-click can still be useful. If you’re asking whether browse abandonment or post-purchase email influenced customer behavior, assisted views matter more.
The same is true for flows versus campaigns.
- Campaigns usually deserve tighter scrutiny on click quality, revenue per recipient, and offer cost.
- Flows often create value through timing and relevance, even when they don’t get the final click.
- Promo-heavy sends need extra skepticism because they can claim easy credit for buyers who were already close.
For teams trying to get past simplistic reporting, this primer on beyond last-click attribution from Refport is a helpful framing tool.
Three operating rules keep attribution honest
First, use disciplined UTM tagging. If naming conventions drift, channel reports become less trustworthy than they look.
Second, separate campaign evaluation from flow evaluation. A welcome series, a cart recovery flow, and a weekend blast don’t deserve one blended revenue number.
Third, anchor decisions to incrementality thinking, not just platform credit. Quikly’s guide to incrementality testing is a good reference if your team tends to over-credit whichever channel touched the order last.
A campaign doesn’t deserve more budget because it touched revenue. It deserves more budget if it created incremental revenue at acceptable margin.
The practical metric I trust most for ongoing operating decisions is revenue per recipient, reviewed alongside offer strength and audience quality. It won’t answer every attribution question, but it keeps the conversation closer to business reality than raw attributed revenue totals.
A Disciplined A/B Testing Workflow for Email Evaluation
Most email A/B testing fails for one reason. The team wants a winner faster than the data can support.
That leads to familiar mistakes. Too many variables change at once. Opens decide tests that should’ve been judged on clicks or orders. Someone calls the test by midday because one version is “clearly ahead.”
Test one thing with one business question
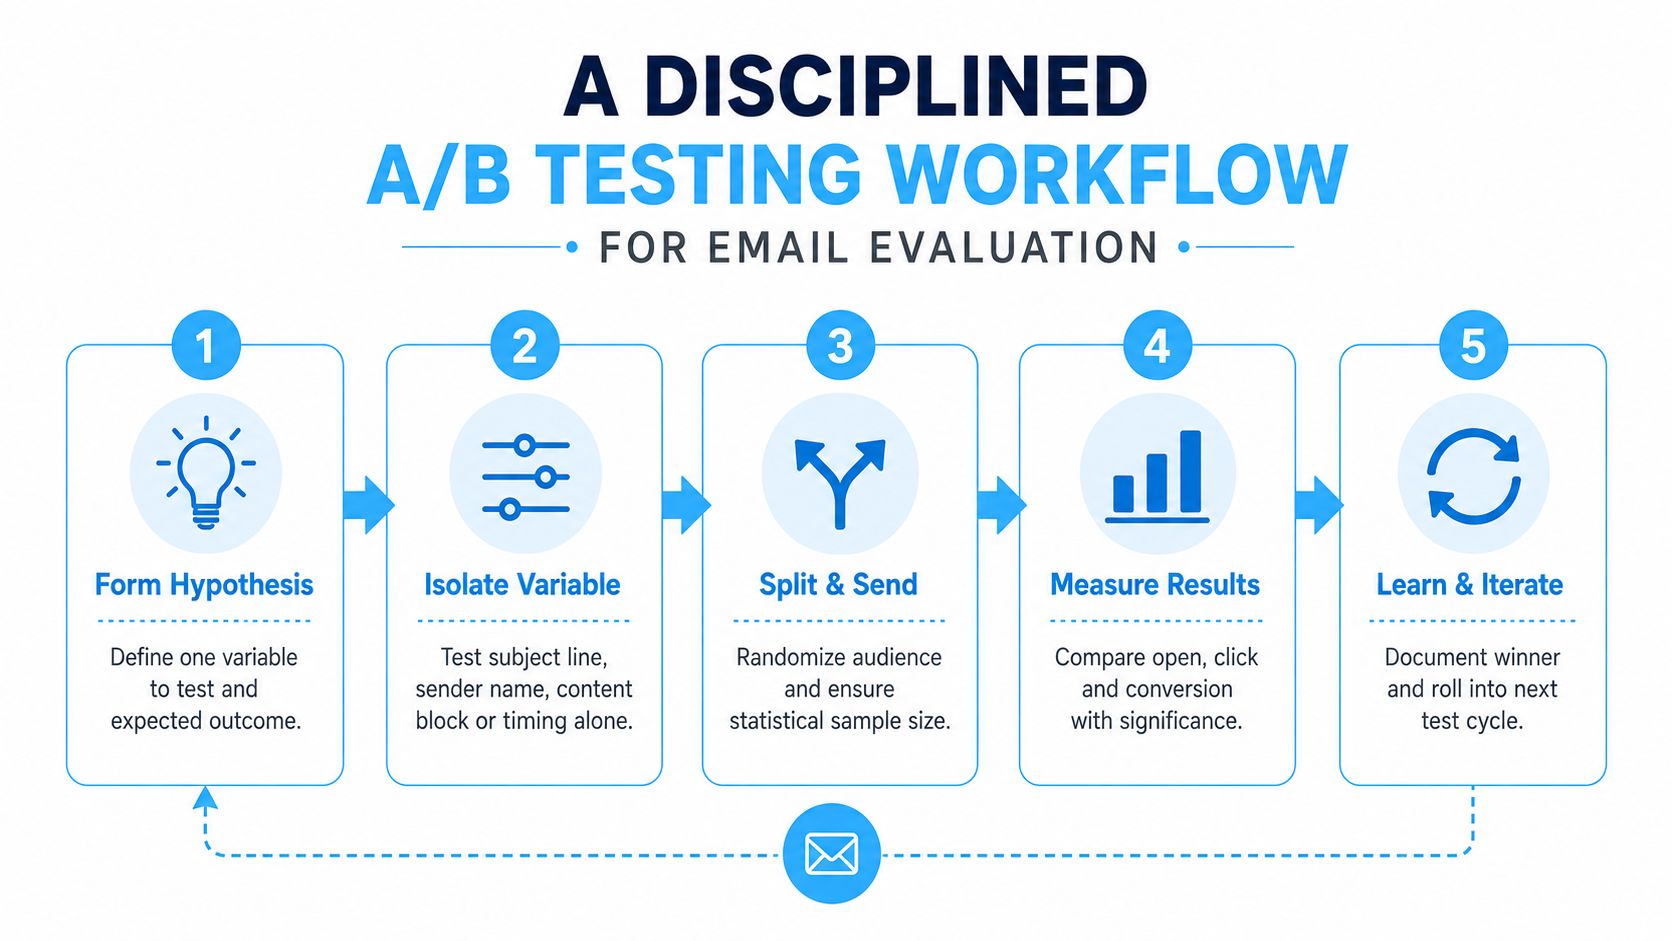
A clean test starts with a narrow hypothesis.
Don’t test subject line, sender name, hero image, CTA copy, and discount framing in the same send. If version B wins, you won’t know why. In Klaviyo or a similar platform, isolate one variable and keep the rest of the email, audience, and send timing stable.
Good examples look like this:
- Subject line test: Can a product-led subject line improve qualified traffic versus a savings-led subject line?
- Content block test: Does moving the social proof block above the product grid improve click quality?
- Offer structure test: Does a tighter reward condition convert better than a flat sitewide discount while protecting margin?
Match the metric to the layer you’re testing
If you’re testing sender name or subject line, open rate can still be a directional read. But if you’re testing content or offer framing, use click-through, click-to-open, conversion, or revenue per recipient as the deciding metric.
Operator note: A subject line can win opens and still lose money if it attracts curiosity clicks that don’t convert.
If your team wants a framework for comparing experimentation tools and workflows, especially across more complex organizations, this comparison for B2B teams from Captiwate can help frame what matters operationally, even if your stack is Shopify-first.
Keep a testing log, not just a winner list
The value of testing isn’t a green badge on version B. It’s institutional memory.
Use a shared document or reporting board that records:
- The hypothesis
- The audience
- The variable tested
- The primary metric
- The result
- What you’ll change next
That prevents teams from rerunning the same ideas every quarter with slightly different wording.
A disciplined workflow is simple:
- Form the hypothesis.
- Isolate one variable.
- Randomize the split.
- Wait long enough to read the result cleanly.
- Record the learning and use it in the next send.
That’s what turns the evaluation of email into a compounding system instead of a string of guesses.
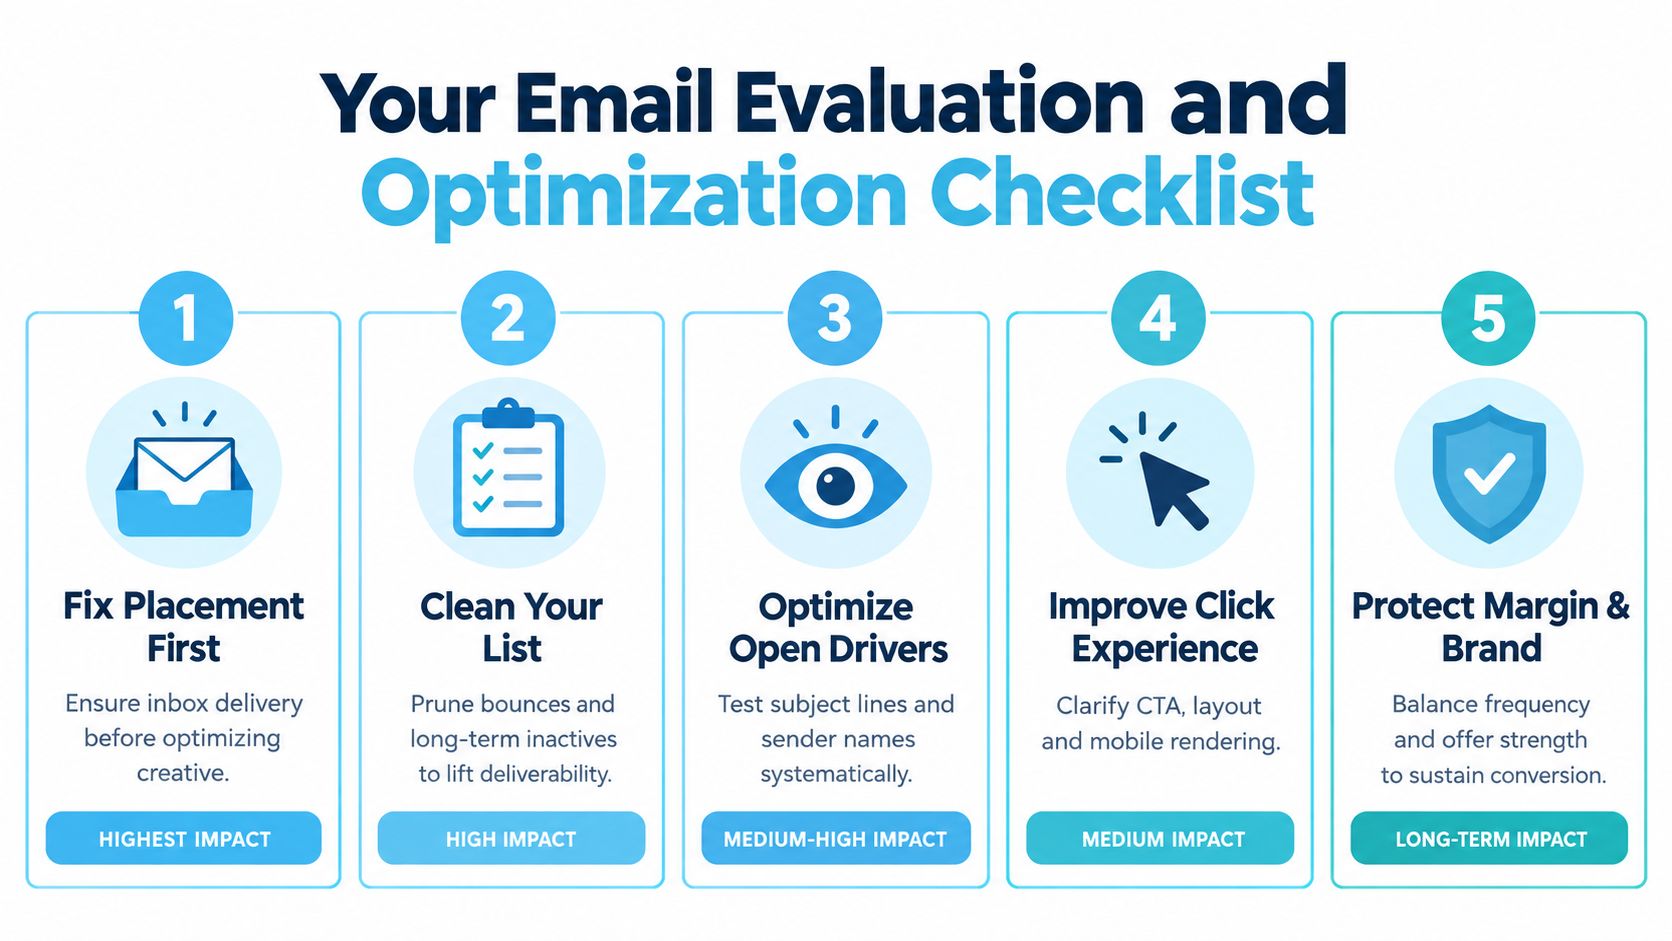
Your Email Evaluation and Optimization Checklist
The fastest way to improve email performance isn’t to chase every metric. It’s to fix the highest-value failure first.
For most Shopify brands, that means resisting the urge to start with opens. Opens feel actionable because they move quickly. But if the program is leaning on heavier promotions to compensate for weak fundamentals, you’re solving the wrong problem and paying for it with margin.
What to check every week
Use weekly review for operating signals that drift fast.
- Placement and reach: Watch provider-level inbox behavior, not just delivered status.
- List stress signals: Review complaints, bounces, and unsubscribe patterns after major sends.
- Funnel drop-off: Identify where the steepest fall is happening from inbox to click to order.
- Revenue quality: Compare revenue per recipient across campaigns with different offer strengths.
What to review every month
Monthly review is where pattern recognition gets sharper.
| Review Area | What to Look For | Why It Matters |
|---|---|---|
| Campaign mix | How often you’re relying on broad promotions versus targeted lifecycle sends | Too much promo volume can train delay behavior |
| Offer structure | Which sends needed the heaviest incentive to perform | Strong revenue at weak economics isn’t a win |
| Audience quality | Whether engaged and unengaged groups are being mailed appropriately | Poor segmentation hurts reputation and conversion together |
| Test learning | Whether recent tests changed actual practice | Testing only matters if it improves the next cycle |
The margin-safe way to improve email
The biggest reframe is this. More conversions are not automatically better if they come from deeper discounts, more frequent promos, or a customer base trained to wait.
Email remains a high-ROI digital channel in broad benchmark summaries, with average returns often reported at roughly $36 to $42 for every $1 spent, and retail or ecommerce often above that range according to this industry roundup. That upside is real. But a strong channel can still be run poorly if teams confuse attributed revenue with healthy revenue.
For brands trying to protect both margin and brand perception, the better path is controlled urgency, tighter audience discipline, and honest evaluation. That means lighter average discounts, better timing, and promotions that reward action instead of teaching customers to wait for the next blanket markdown.
Run one focused audit this week. Pick the weakest layer in your funnel, fix that first, and let the next test answer one clean question.
If you do that consistently, email stops being a volume game and becomes a higher-quality revenue channel.
Quikly helps Shopify brands turn promotions into on-brand urgency and scarcity experiences that move customers to act now instead of waiting for the next flat discount. If your email evaluation shows that conversions depend too heavily on broad markdowns, Quikly is worth a look because it gives teams a way to lift response while protecting margin and brand perception.
Topics: evaluation of email, email marketing KPIs, email deliverability, email attribution, Shopify email optimization